How prompts are generated
To ensure diversity and realistic context, prompts are generated across three user-intention types:| Intent type | What it captures |
|---|---|
| Information request | Educational or factual prompts emphasising expert, authoritative sources. |
| Media & social retrieval | Prompts based on news, opinion and social media — capturing public discourse. |
| Product purchase | Queries reflecting buying intent, surfacing retail and commercial sources. |
How the Influence Score works
Each source receives an Influence Score based on how frequently it appears and how prominently it is positioned across AI-generated responses. The formula combines two dimensions:- Frequency (75%) — how often a domain appears in responses.
- Position (25%) — how high that domain ranks in the list.
Why position matters more at the top
People look more at the top of any list, so the formula uses a curve that gives extra credit to websites in the first few positions — similar to how Google search treats the top of a SERP.Why this works well
- More frequent = more visible and likely more trusted.
- Higher position = more attention from users.
- Combined, both produce a strong picture of which websites users are most likely to see and trust in AI results.
Score interpretation
| Score range | Reading |
|---|---|
| 50–100 | Domain is frequently cited and appears in prominent positions. |
| 20–50 | Moderate citation frequency and/or positioning. |
| Below 20 | Limited presence or appears in less visible positions. |
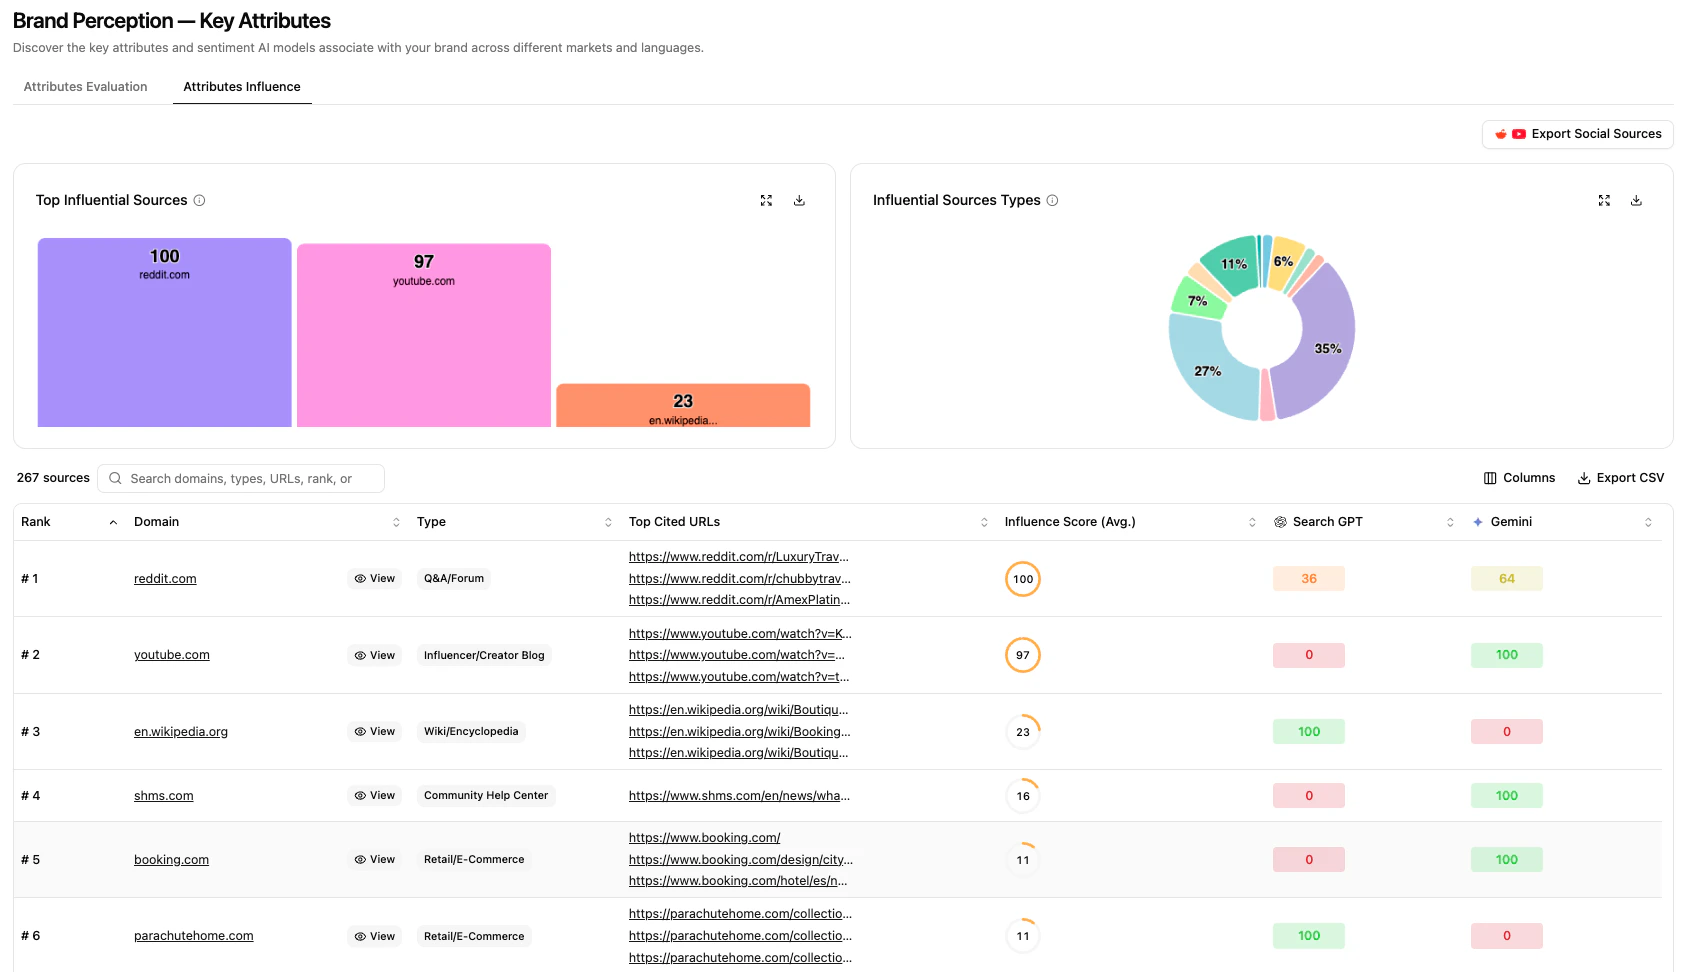
Interface components
Top Influential Sources
Bar chart of the three most influential domains and their scores — immediate insight into market leaders.
Source Types
Pie-chart breakdown of source types (Specialist Blogs, News Media, Retail/Commerce, etc.) — understand the media landscape for your category.
Source Changes
Trend visualisation showing how source influence evolves — track shifting AI preferences and emerging influential domains.
Detailed source table
| Column | Description |
|---|---|
| Rank | Position in the influence hierarchy. |
| Domain | Source website. |
| Type | Category classification (News Media, Specialist Blog, Branded site, Retail/E-commerce, etc.). |
| Top Cited URLs | Most frequently referenced pages. |
| Influence Score | Average visibility metric. |
| SearchGPT & Gemini | Platform-specific performance indicators. |
In the Sources module, the analysis is not centered on brand mentions. The brand and competitor analysis parameters are not used in this section. Data collection prompts rely only on:
- the analysis category,
- the analysis attributes,
- the countries.
What’s next
Reddit Feed
Inspect Reddit conversations behind the scores.
Sources & Links (Search)
See sources and links inside the Search module.