What this view helps you analyse
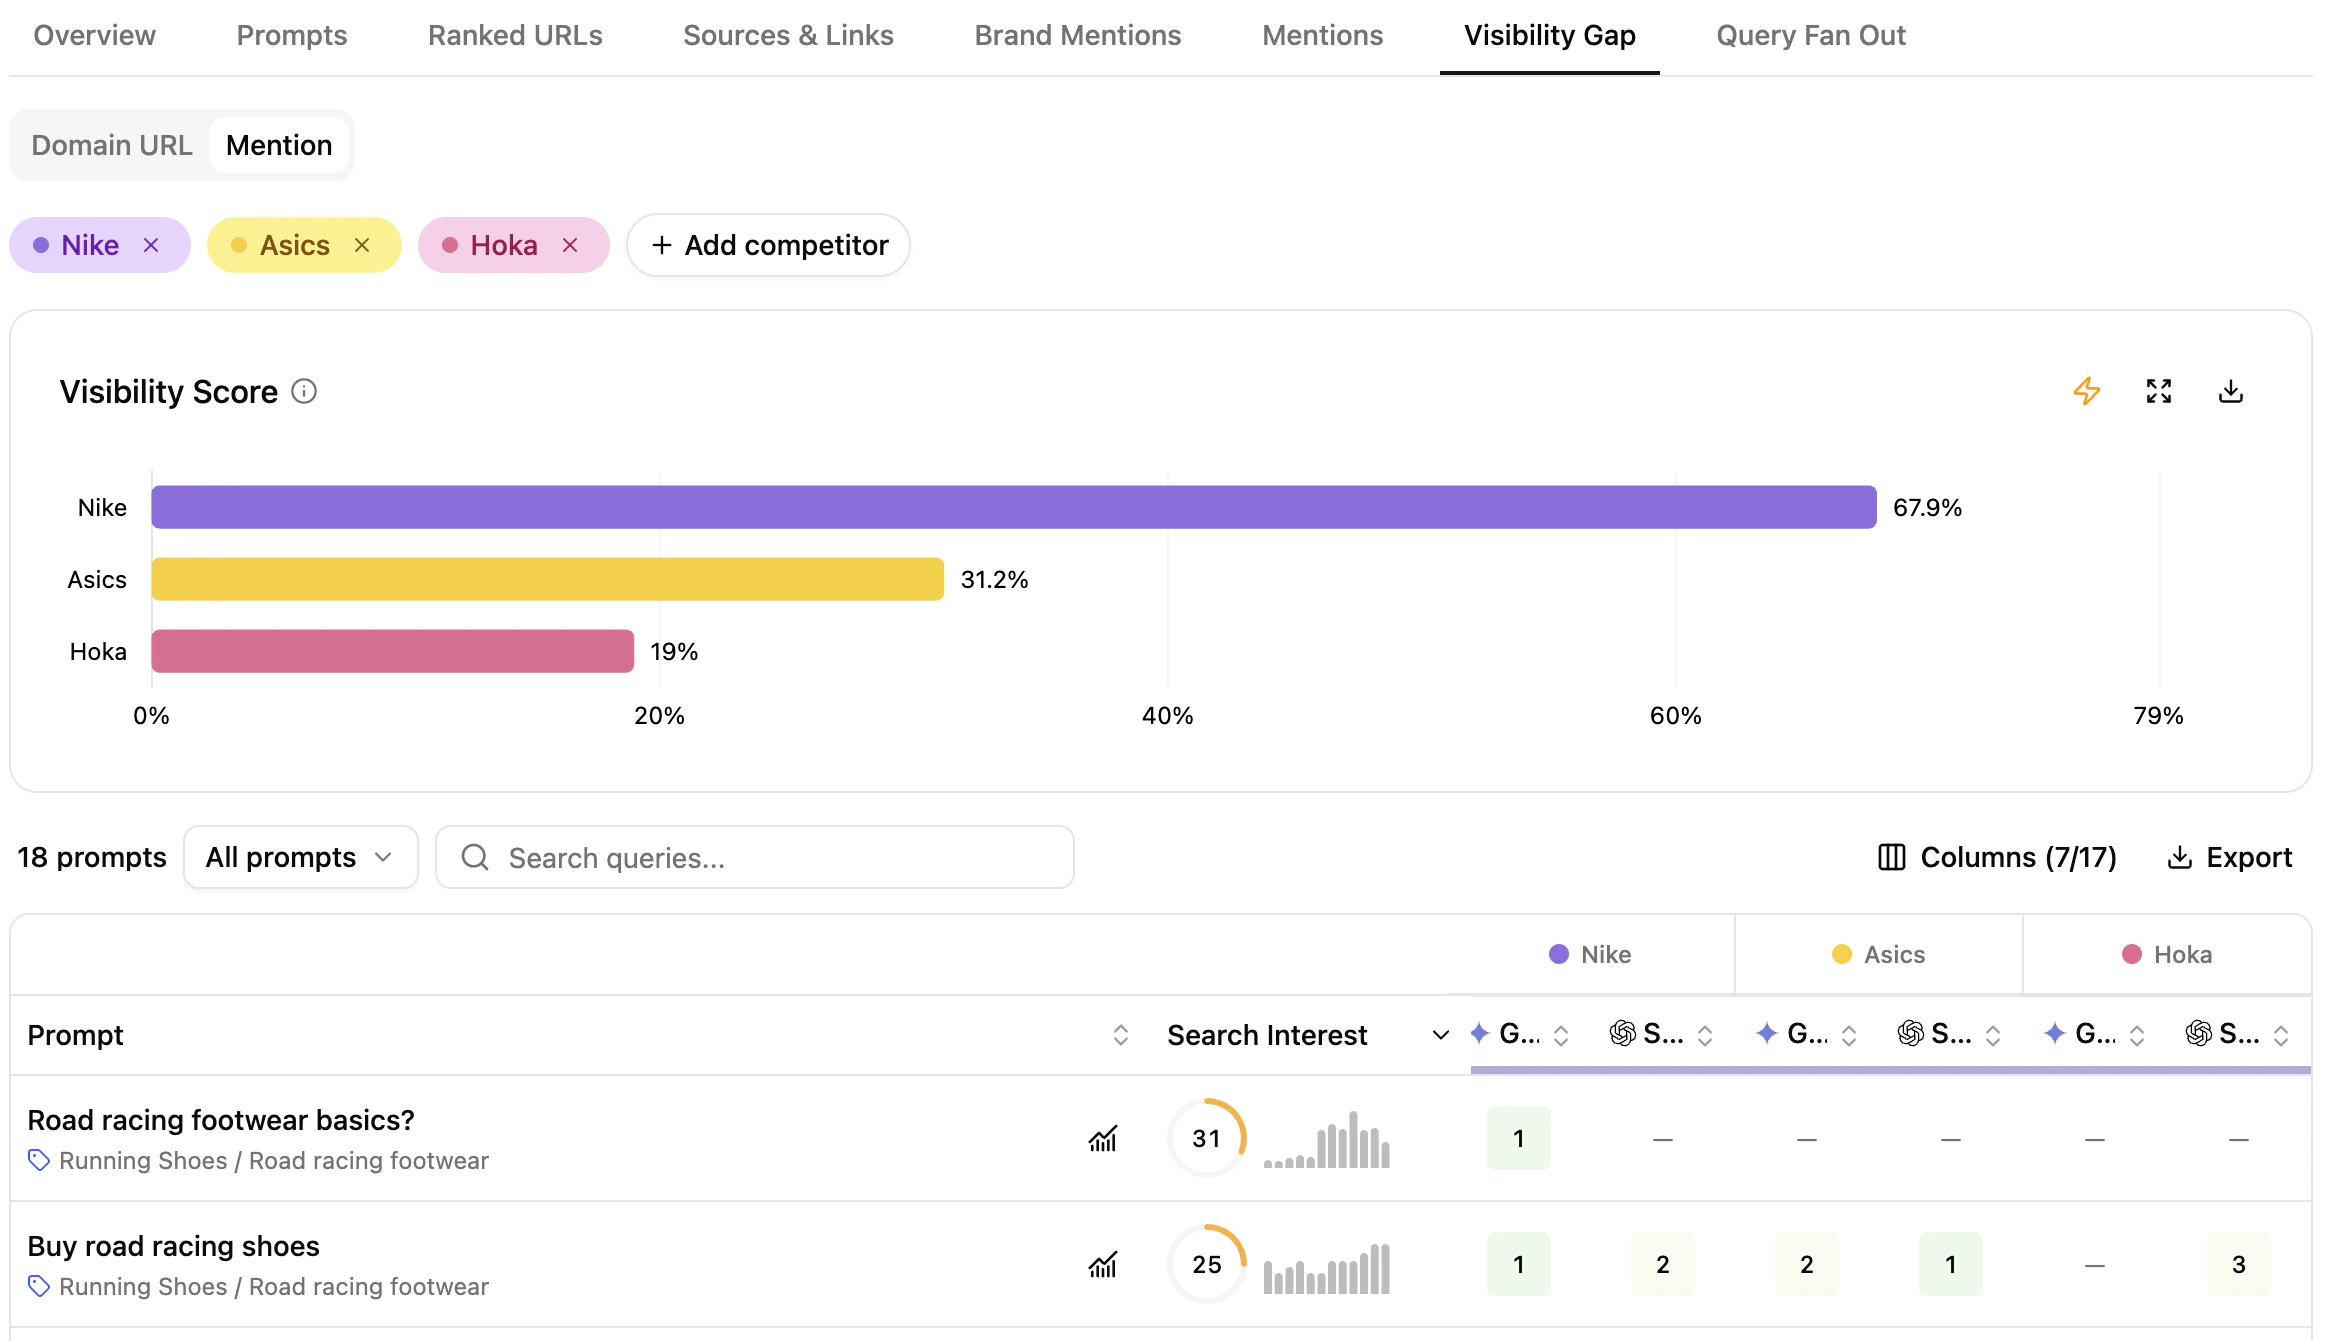
You get prompt-level comparison of your domain and brand against competitors across both traditional and generative engines.Domain & Brand performance comparison
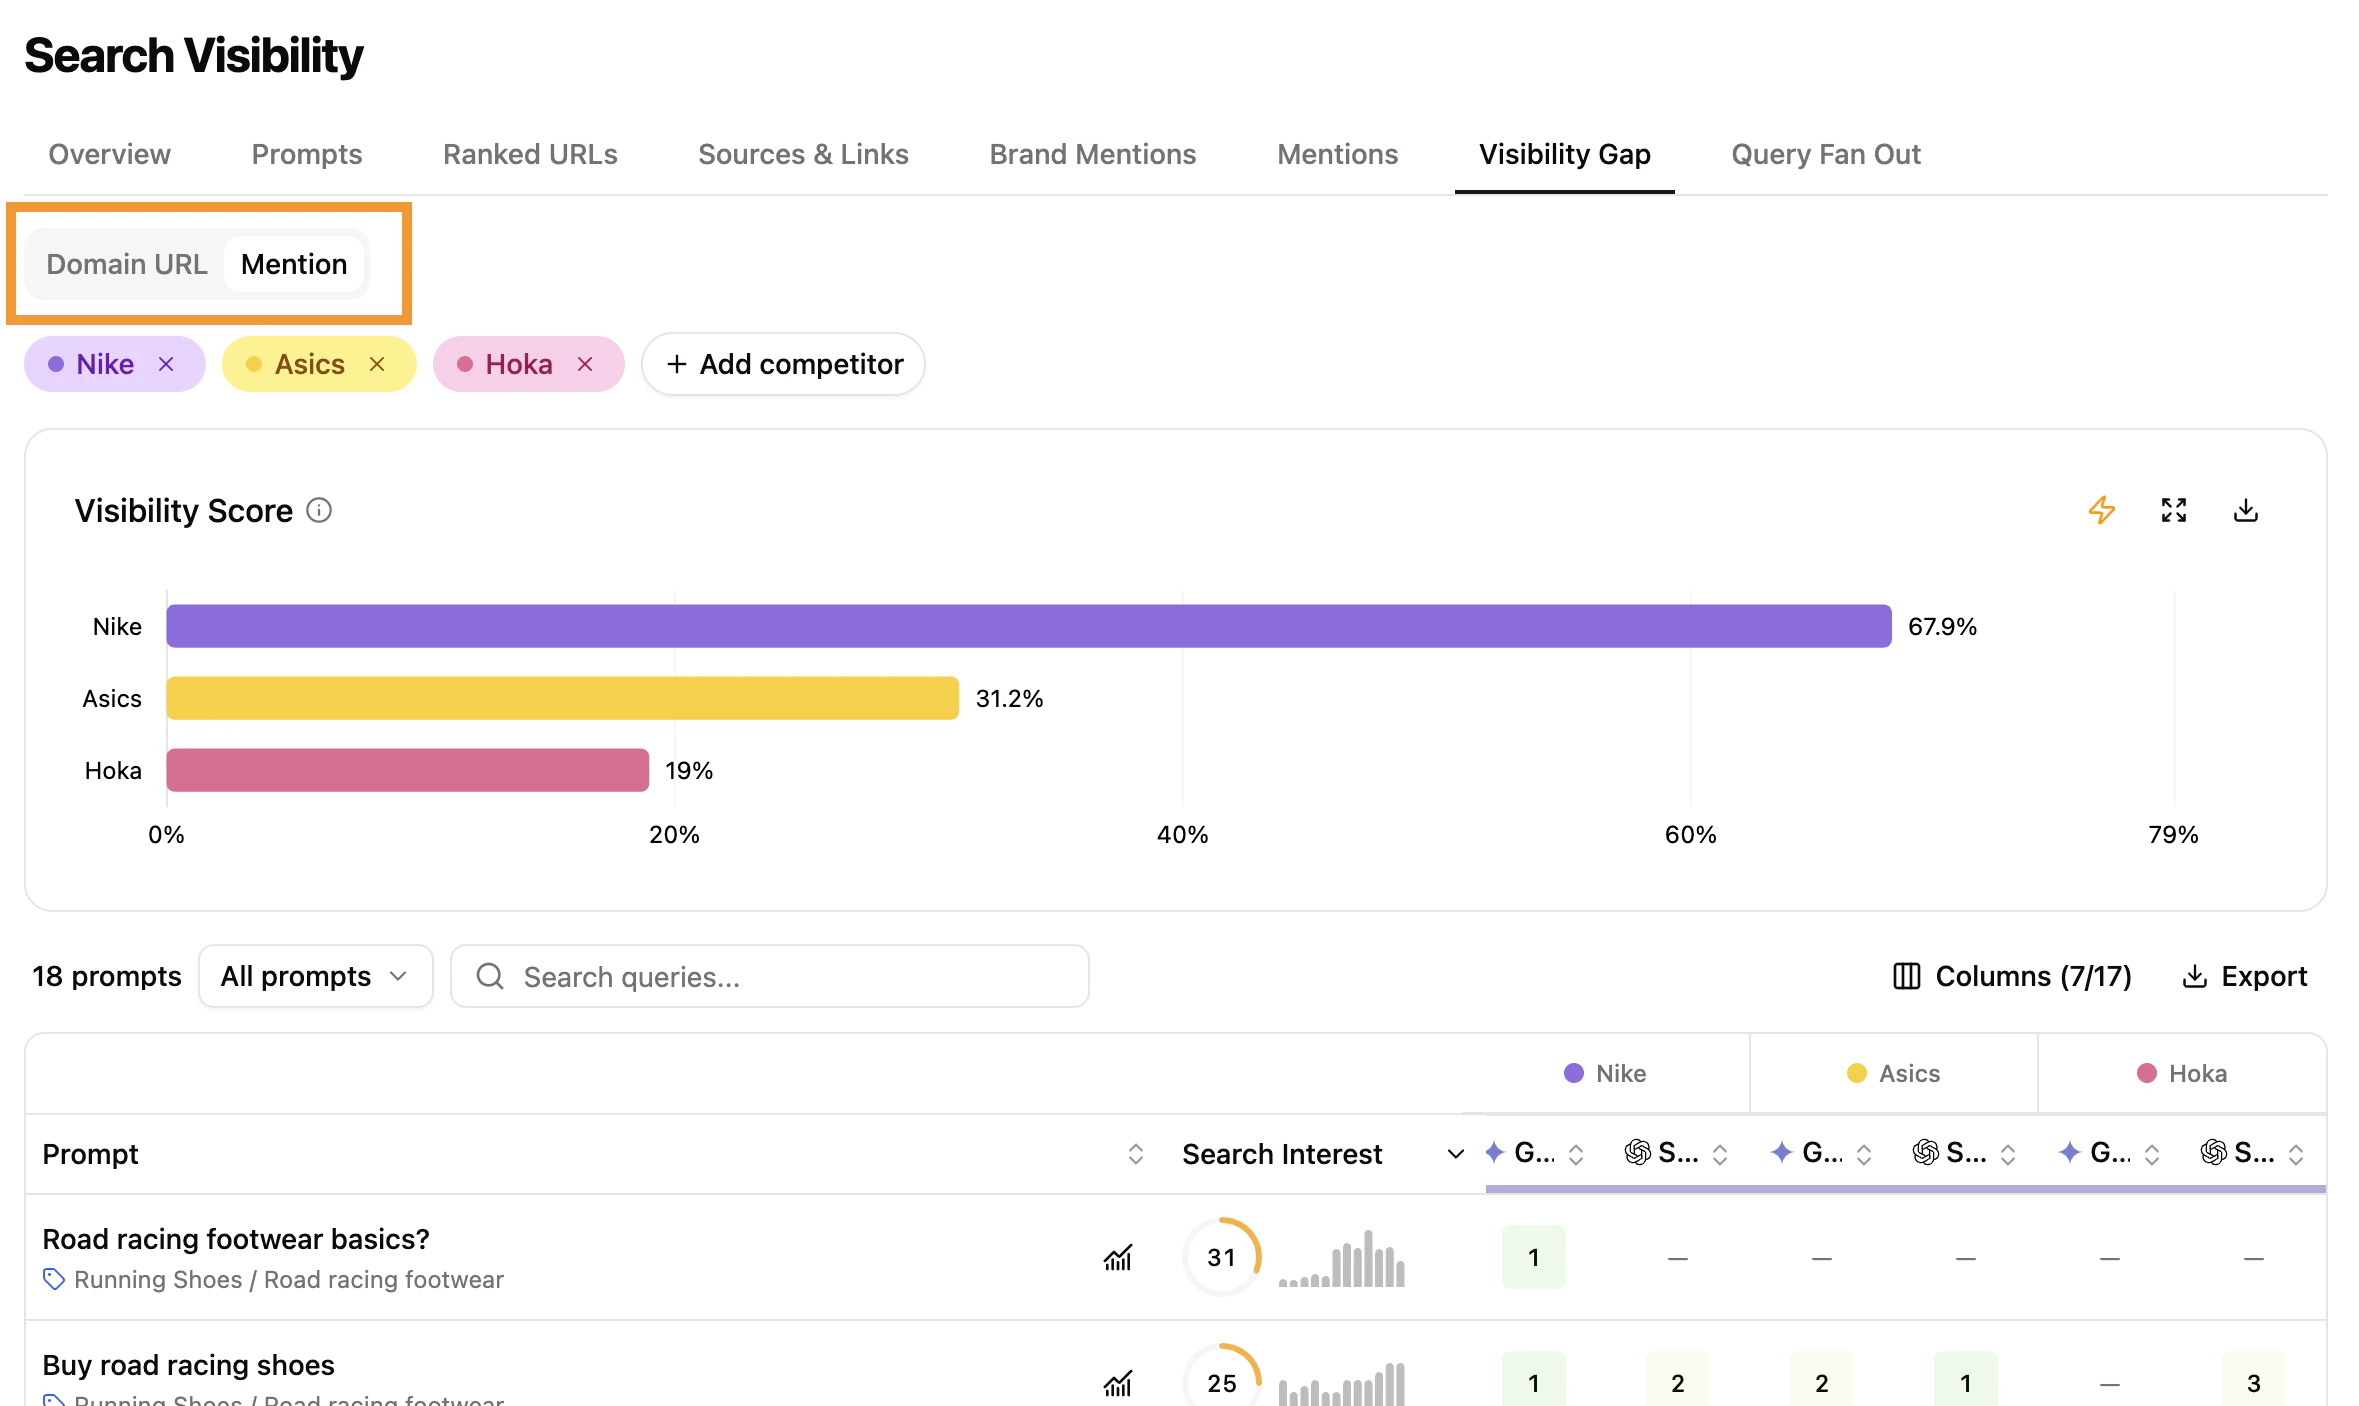
The module exposes two complementary modes:- Domain URL view — competitor domain positions across engines (similar to Overview).
- Brand Mention view — brand presence across engines, for awareness analysis.
Compare visibility scores against competitors
The chart spotlights industry leaders and visibility gaps where your domain or brand can improve.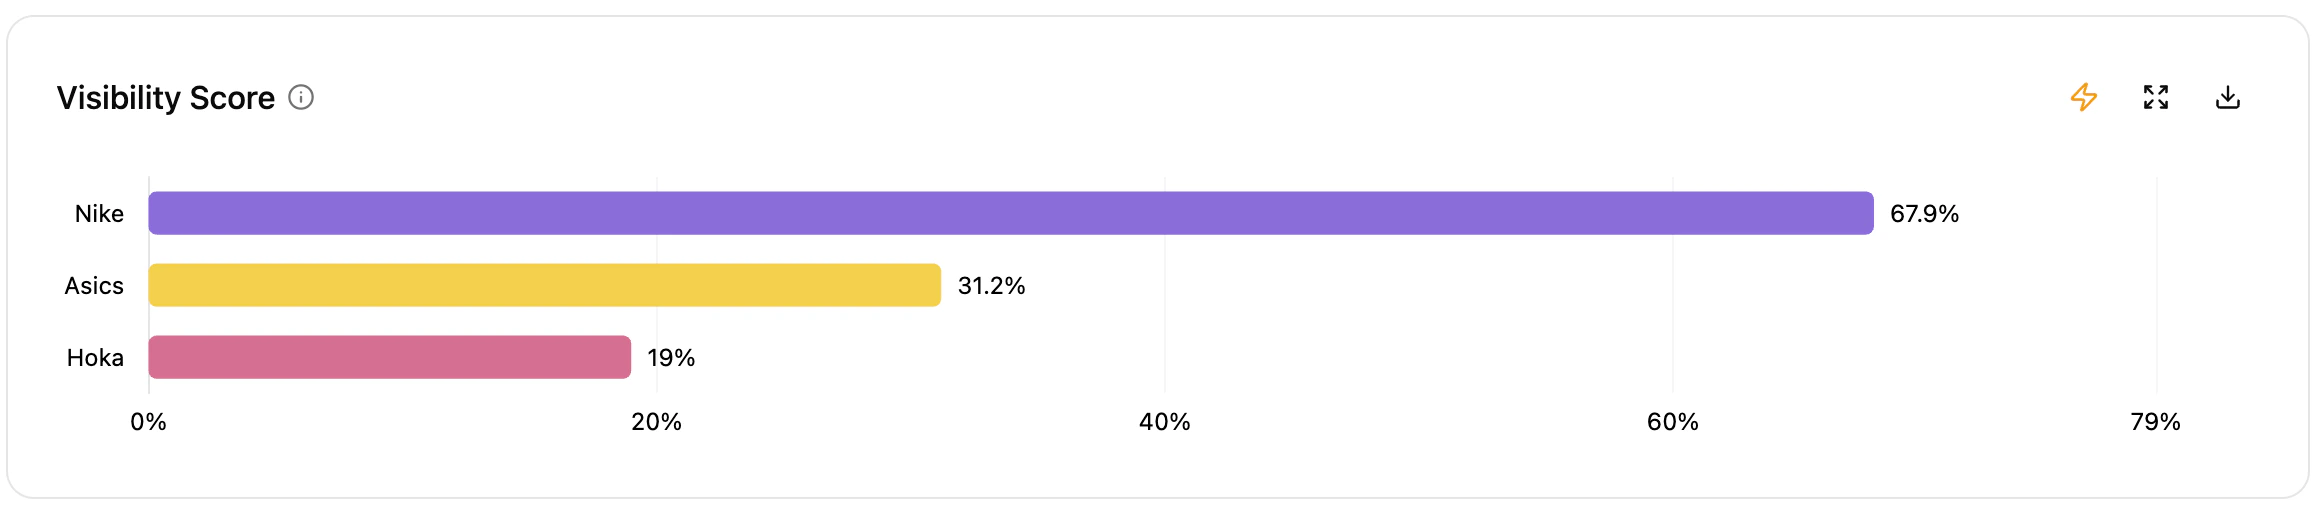
Select competitors
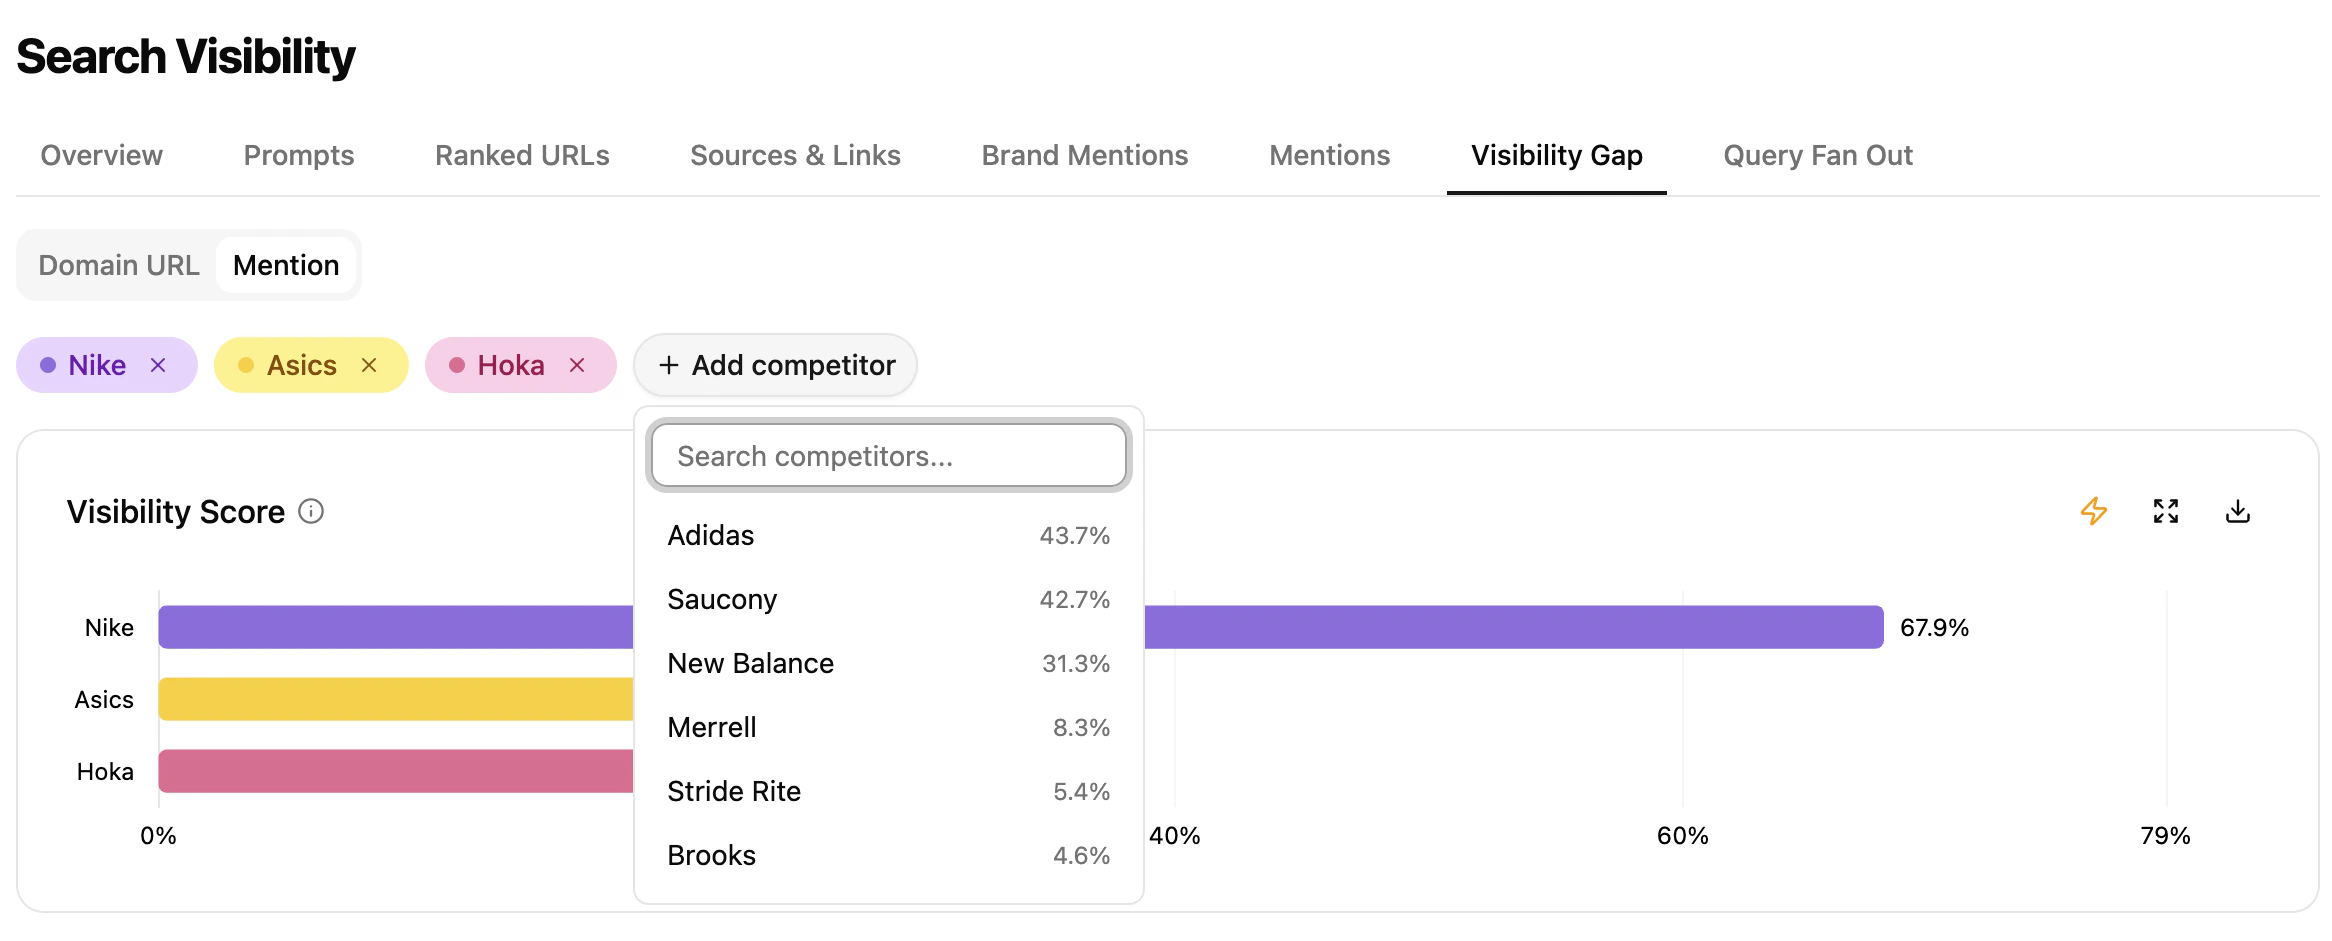
- Pick up to 4 competitors (brand or subdomain) from the dropdown.
- Remove and add competitors freely — the data updates instantly.
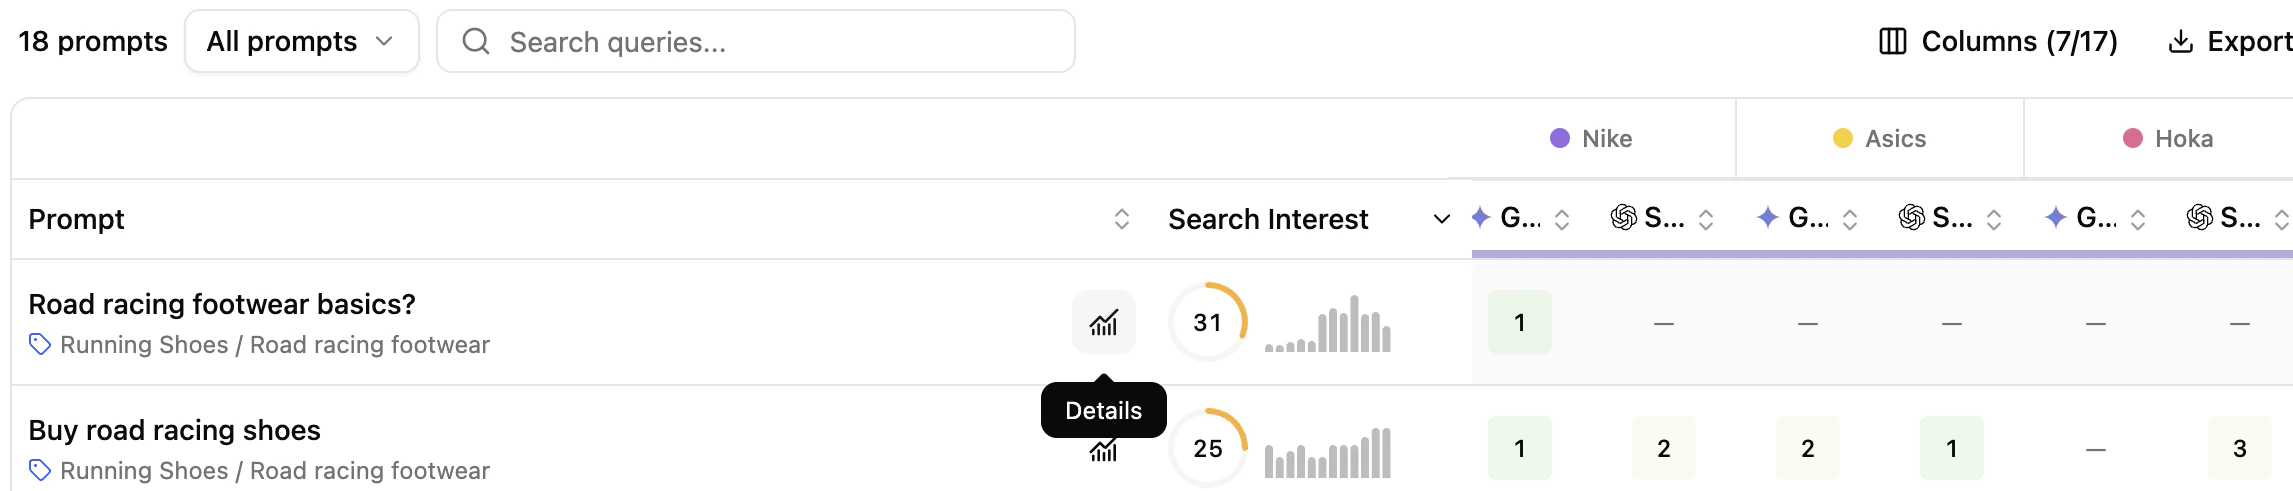
Prompt-level insights across engines and competitors
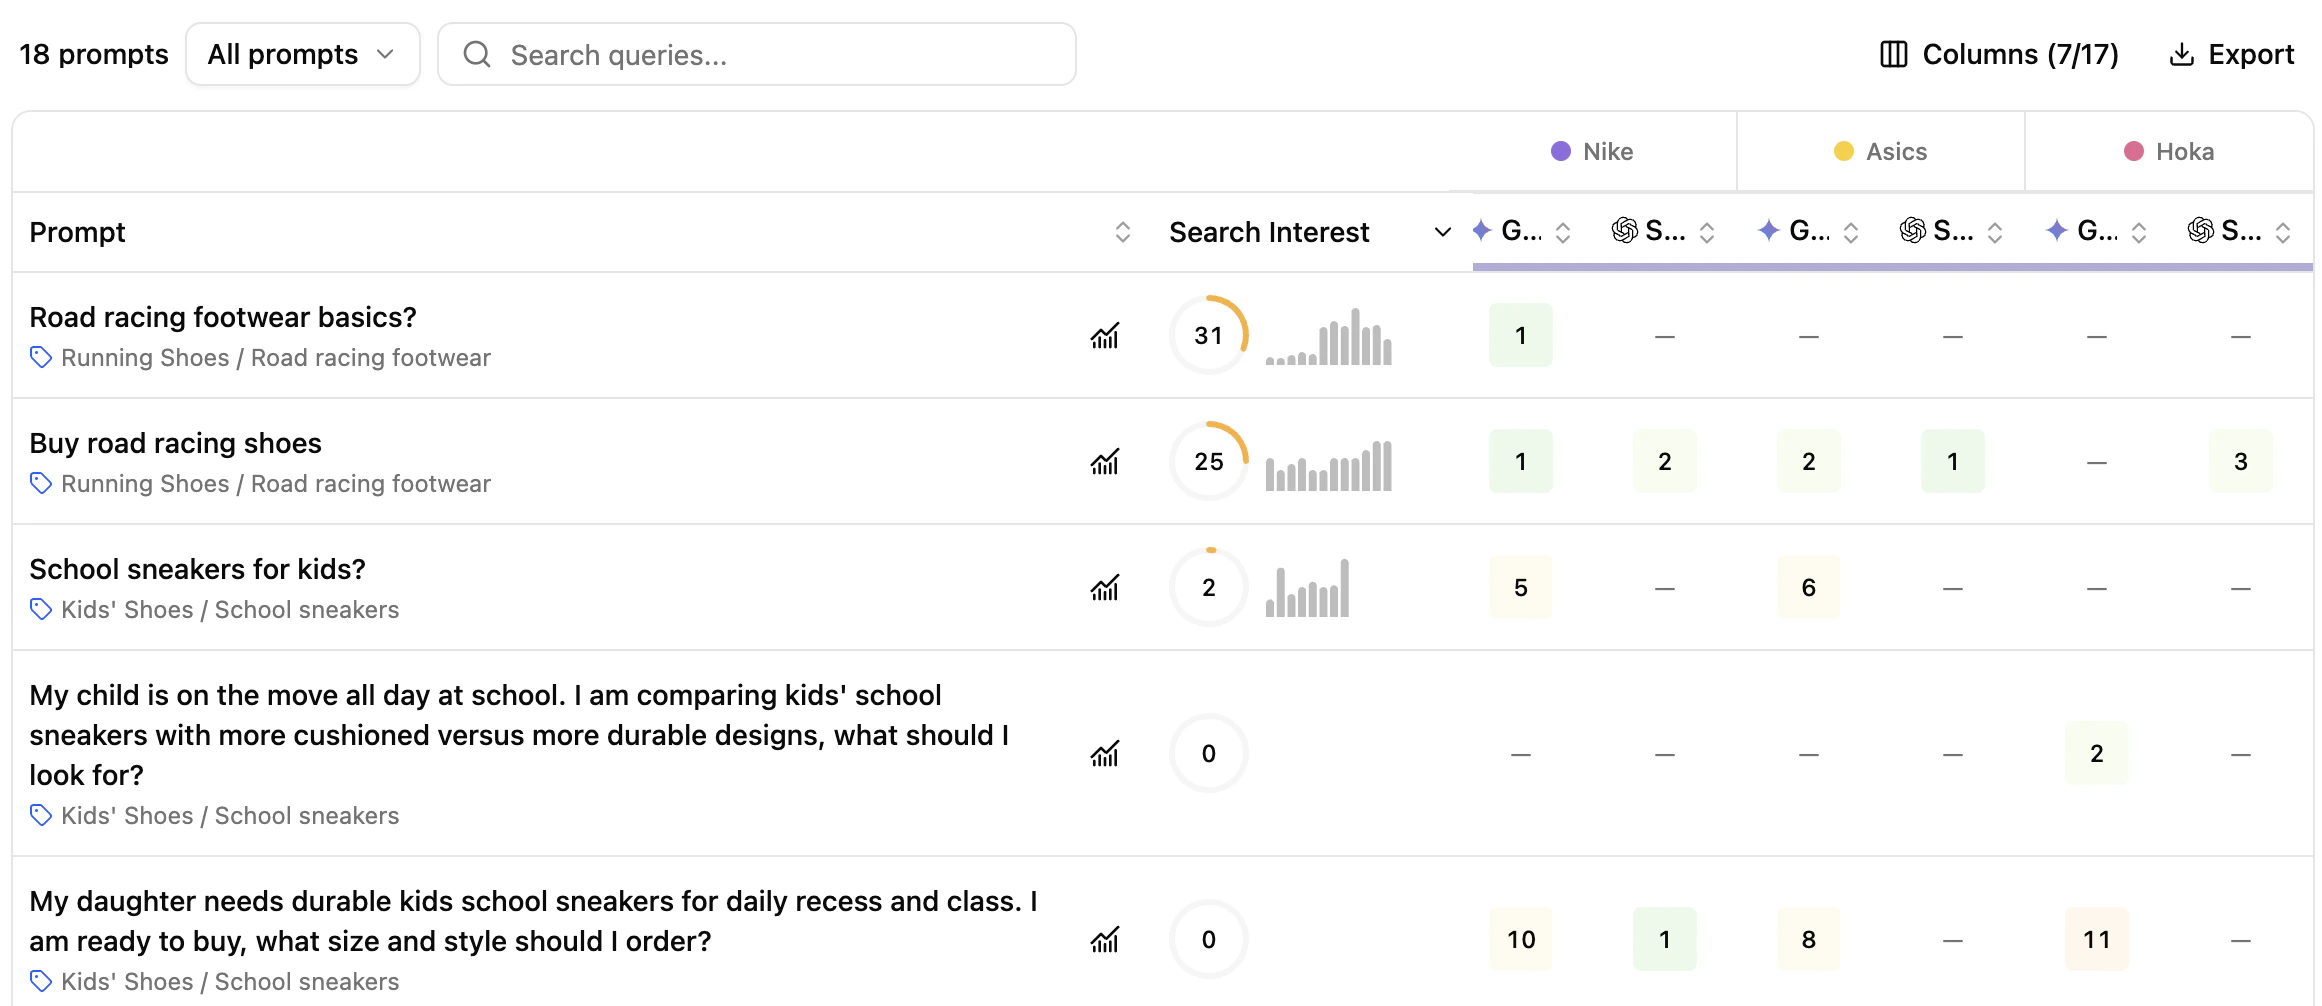
- Prompt — tracked prompts with search type (Generic / Brand) and intent (Navigational, Informational, Commercial, Transactional).
- Search Interest — score based on Google Ad Planner search volume of the main keywords, weighted by relevance and 12-month trend.
- Competitors — competitor domains and brand mentions per engine, compared to yours.
- Engines — position across:
- Search engines (Google, Bing) — domain URL only
- AI Overviews (Google AI Overview, Bing AI Overview) — both modes
- Generative engines (Gemini, Perplexity, SearchGPT, Google AI Mode, Claude) — both modes
Data aligns with the Prompts tab, so you can track presence and performance across views consistently.
Key benefits
- Visualize where your domain and competitors are positioned, and where brand mentions surface.
- Compare your prompt-level URLs and brand mentions to those of competitors.
- Build a clear picture of your market positioning.
Extra features
Filters- Refine displayed data dynamically — filters propagate to the side panel.
- Export chart as PNG or its data as CSV.
- Expand chart for a larger view.
- Ask Assistant to trigger an automatic analysis of the chart.
- Add/Hide columns for readability.
- Export filtered tables to CSV or Excel.
- Search the table.
- Sort by any column.
What’s next
Brand Mentions
Identify the brands that dominate the space.
Prompts
Drill into prompt-level performance.