What this view helps you analyse
You can switch between Domain view and Brand Mentions view to read the data at the level that matters most to you. Three engine families are tracked:- Search engines — Google, Bing
- AI Overviews — Google AI Overview, Bing AI Overview
- Generative engines — Gemini, Perplexity, SearchGPT, Google AI Mode, Claude
Domain & Brand Visibility Score
Measures the visibility of your domain and brand mentions across the three engine families. Each family uses a distinct color (blue for traditional search, orange for AI Overviews, purple for generative engines).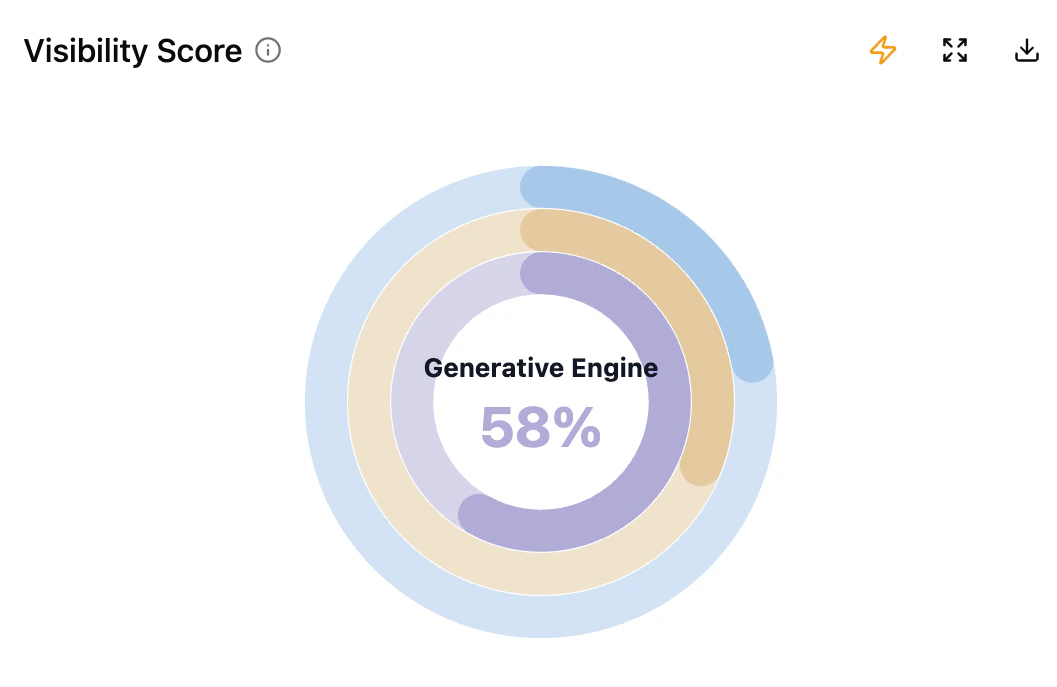
Domain Average Top Position
Visualises the average position of your domain (URL as Link) across each engine. Brand mentions are not factored in.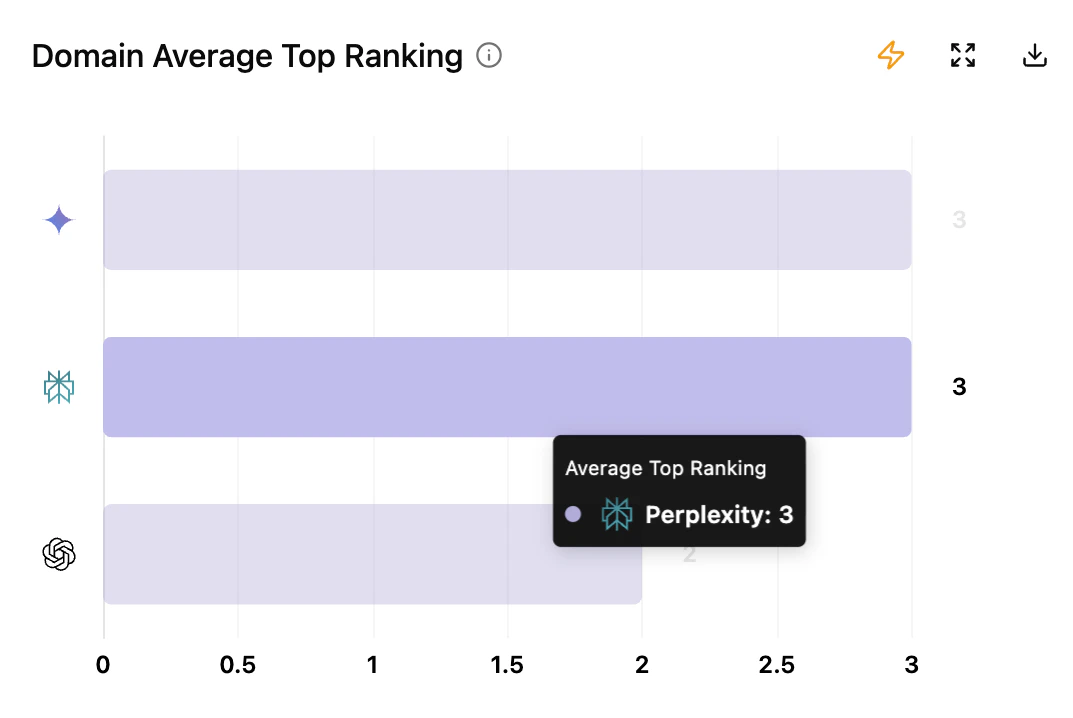
- X-axis — average position
- Y-axis — engines
- Engine type colors are preserved for cross-chart comparison.
Domain Presence Rate (as Link)
Heatmap of your domain’s presence as a website URL inside answers, by thematic.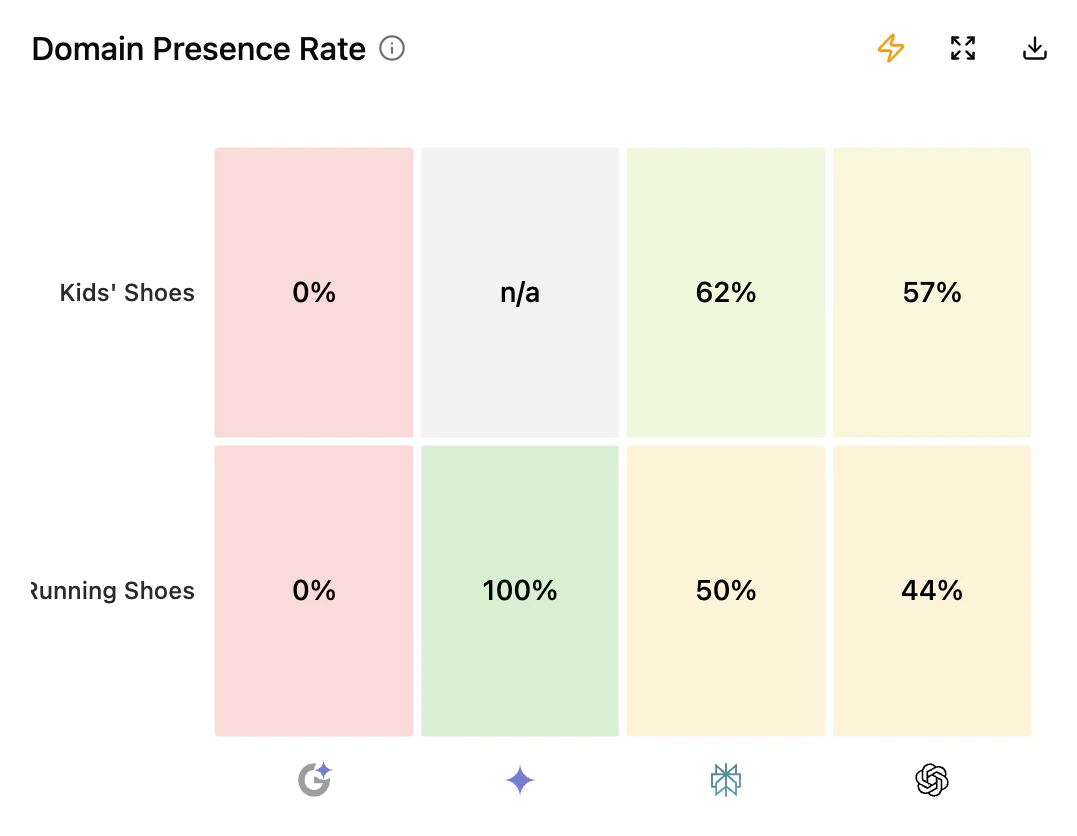
- X-axis — engines audited
- Y-axis — thematics defined during setup
- Color — deep red for weak presence, green for strong presence
- A score of
0%means the domain is absent from that topic.
Brand Mention Presence Rate
Heatmap of brand mentions (textual) across thematics and engines.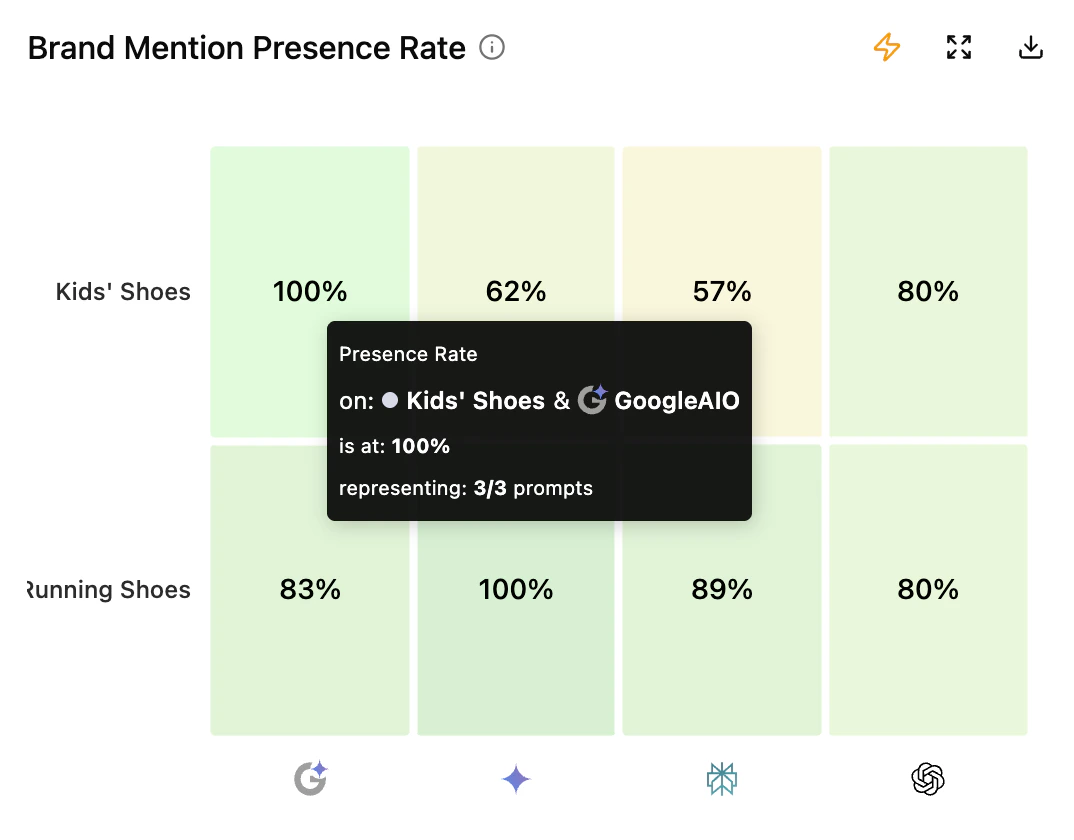
Brand mention presence rate excludes traditional engines (Google, Bing). Mentions are extracted from generative answers only.
Thematics & Topics table
Aggregates how your domains and brand mentions perform across the engines you track, broken down by the thematics and topics defined during setup.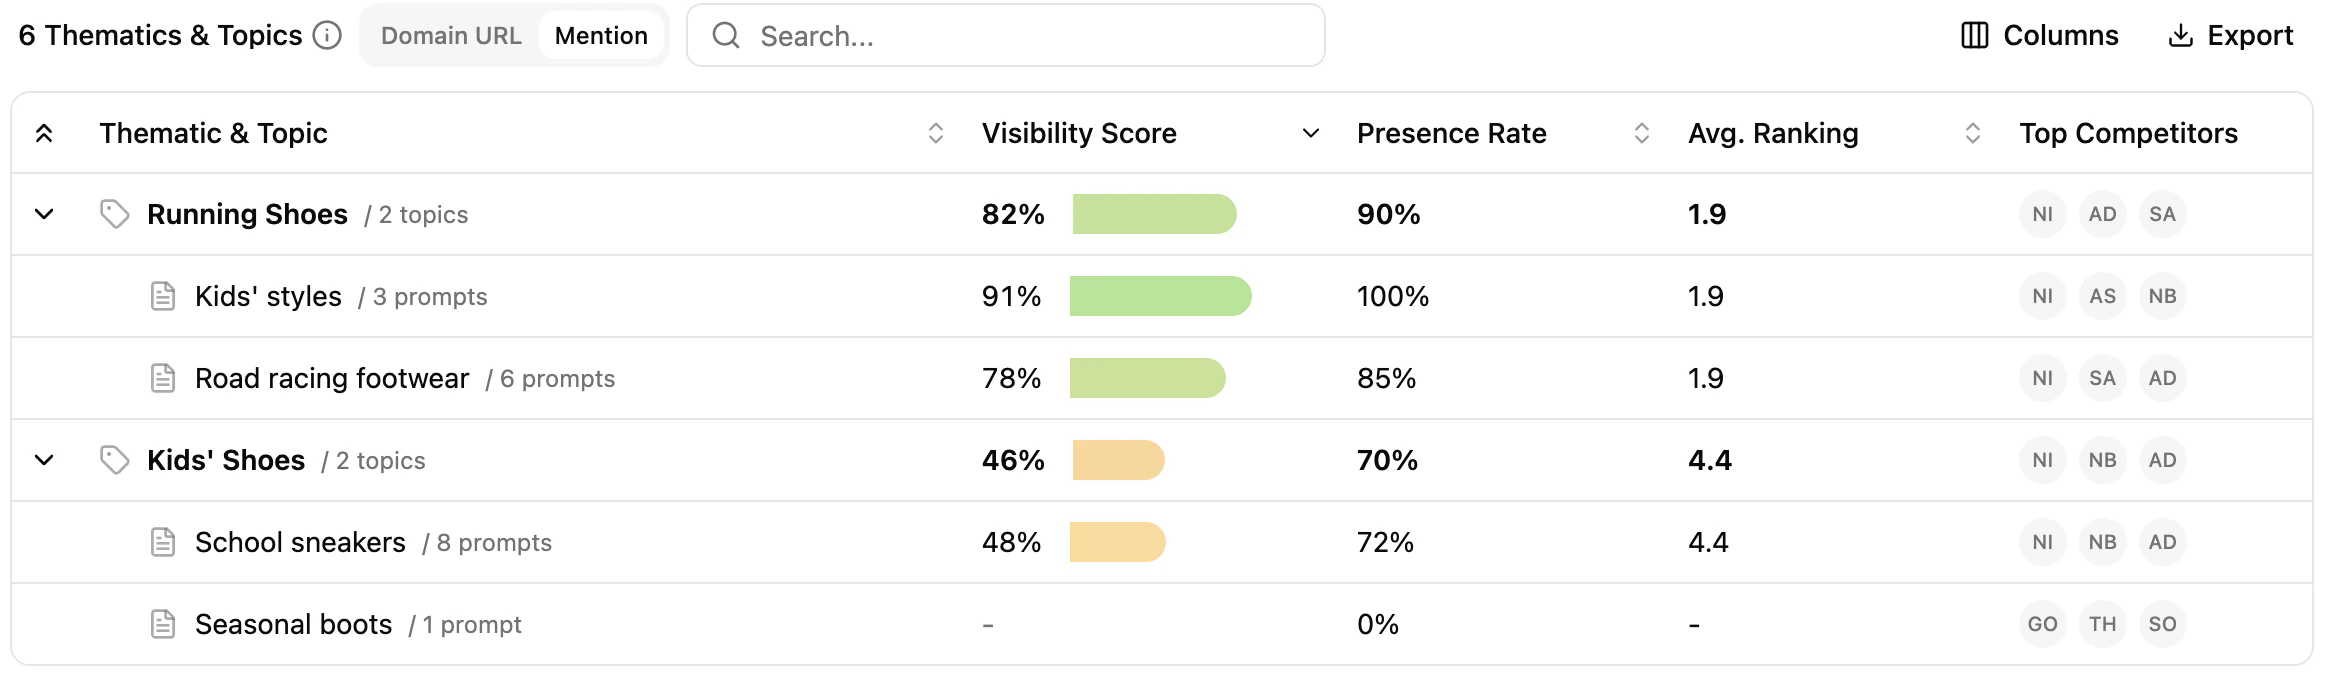
- Thematics & Topics — every tracked search query, grouped by thematic. Click a topic to jump into the Search Queries module pre-filtered.
- Visibility score — overall score per thematic; expand to see per-topic detail for domains or brand mentions.
- Presence rate — percentage of results where your domain or brand appears. Weekly projects also show the trend since the start of the analysis.
- Average position — closer to 1 means a stronger position. Aggregated across topics for the thematic level.
- Top competitors — top 3 competitors per thematic and per topic, on the engines triggered.
Key benefits
- A global and detailed view of visibility across the engines triggered.
- Visibility score, presence rate and position (rankings) at a glance.
- Domain vs. brand mention toggle for deeper insight.
- Spot overlaps, gaps and opportunities across search queries.
- Compare your performance with top competitors instantly.
Extra chart features
- Export — download the chart as PNG or its data as CSV.
- Expand — display the chart in a larger view.
- Ask Assistant — open the agent to trigger an automatic analysis of the insights.
What’s next
Prompts
Drill into prompt-level rankings and SERP snapshots.
Visibility Gap
Compare your performance with up to four competitors.
Sources & Links
See which domains influence answers and which appear as links.
Visibility Score
Understand how the score is computed and read.