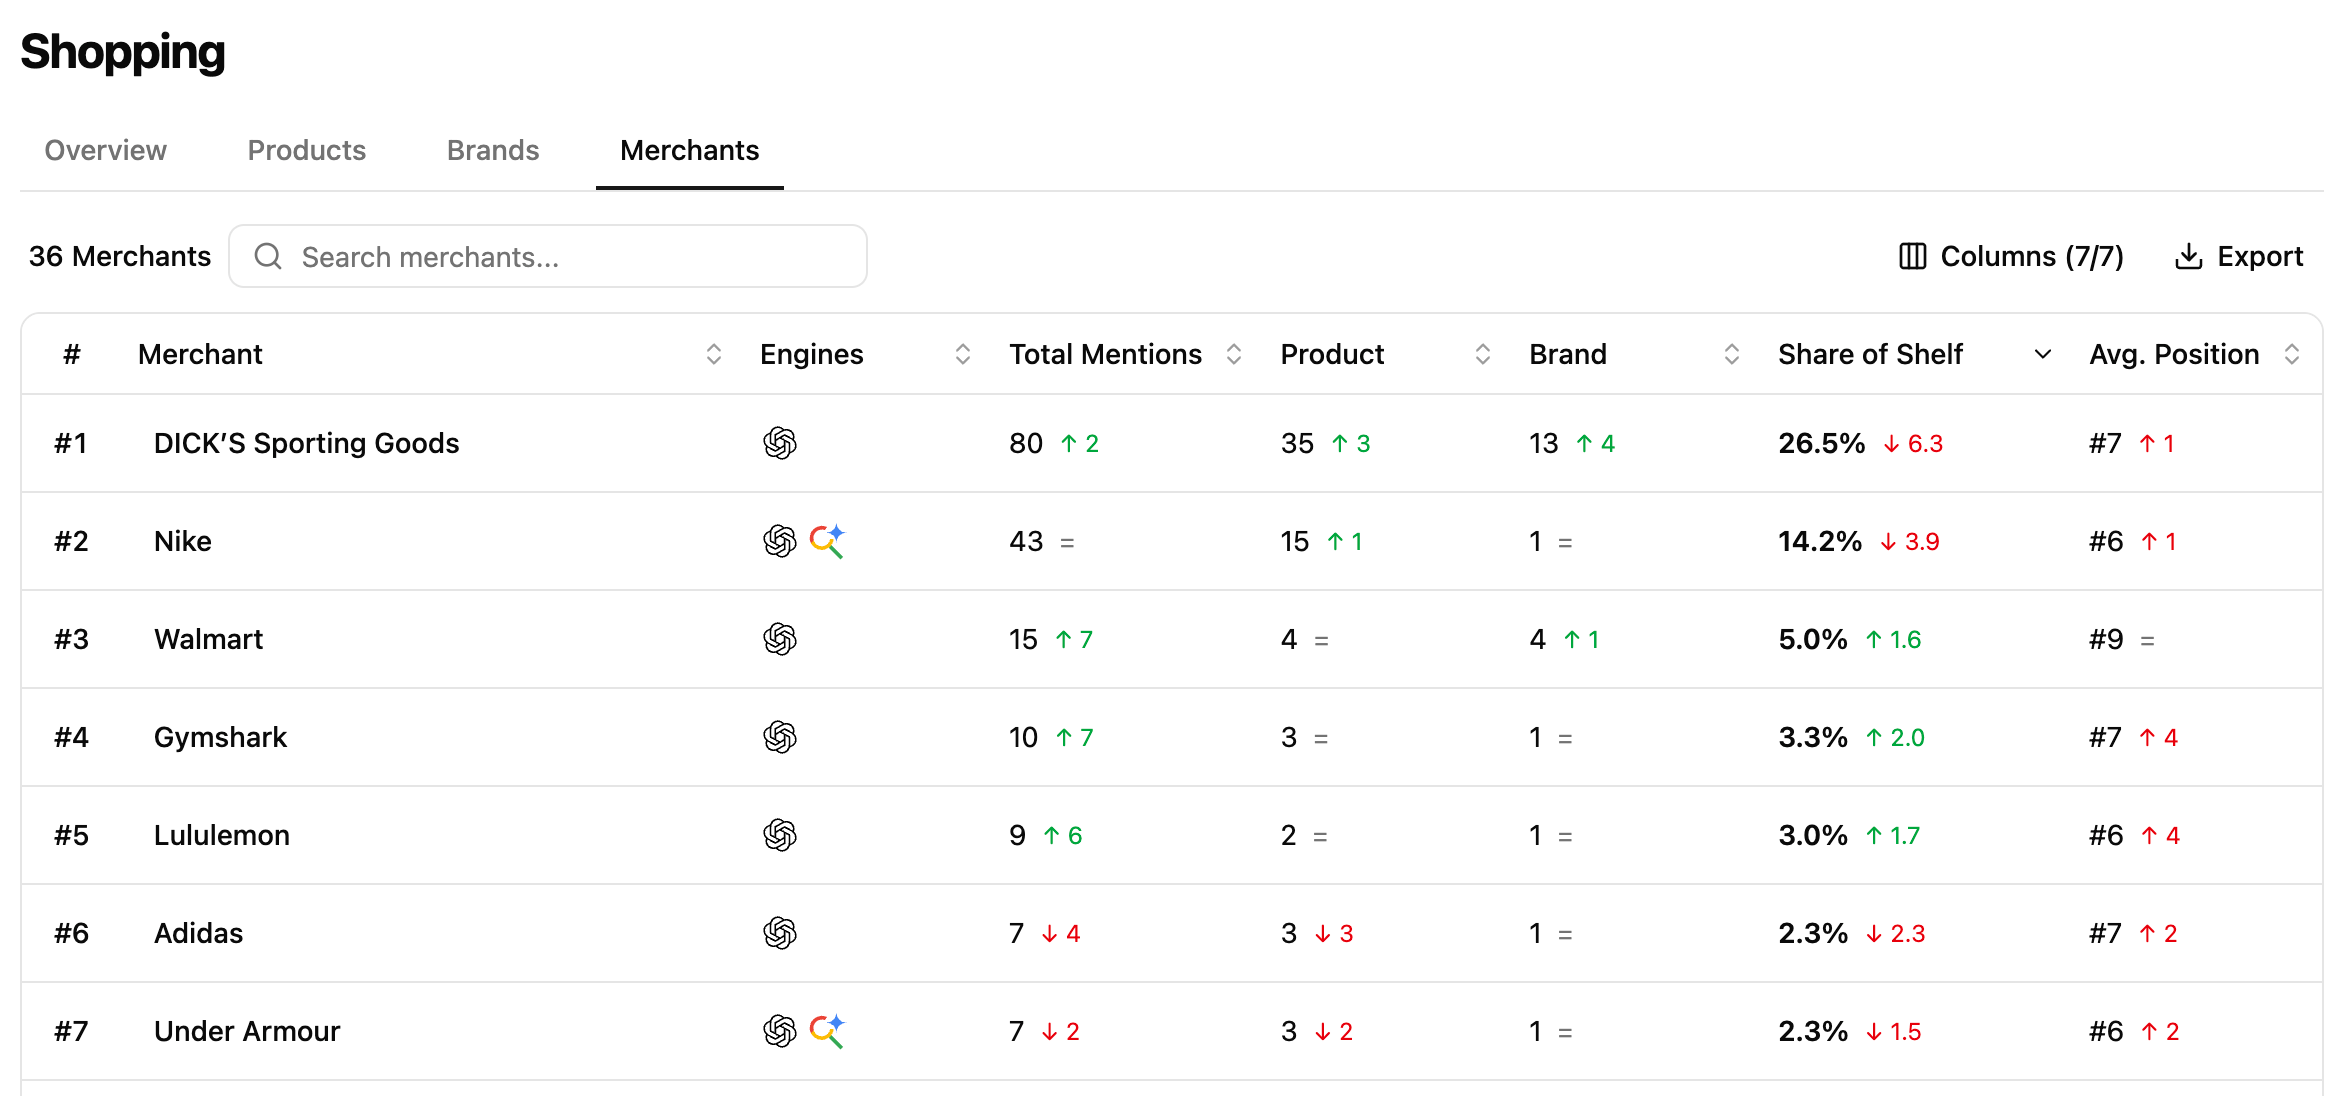
Conversational AI doesn’t only recommend products. It often recommends where to buy them. For every recommended product, AI assistants may surface one or several merchants, giving users direct purchase options as part of the shopping experience. The Merchants view helps you understand which retailers occupy the AI Shelf, how frequently they appear across recommendations, and which products generate their visibility. This perspective complements product and brand analysis by revealing who captures the commercial opportunity created by AI recommendations.

What this view helps you analyse

The Merchants view helps answer questions such as:
  • Which merchants appear most frequently across AI shopping recommendations?
  • Which retailers capture the largest Share of Shelf?
  • Which merchants are consistently displayed in prominent positions?
  • Which products contribute most to a merchant’s visibility?
  • Which retailers dominate recommendations for your category?
  • Which commercial partners are most visible across conversational shopping experiences?
This view provides the distribution perspective of your AI shopping ecosystem.

Comparing merchant visibility

Screenshot 2026 07 27 At 16 54 21
Each row represents a merchant identified across your tracked shopping placements. The table aggregates the visibility generated by every product associated with that merchant, allowing you to compare retailers based on their recommendation presence. For each merchant, you can analyse metrics such as:
  • Share of Shelf
  • Average Position
  • Number of recommended products
  • Recommendation frequency (Total Mentions)
Together, these metrics help distinguish merchants that dominate because they carry a broad catalogue of recommended products, while others generate strong visibility through a smaller number of highly visible products.
Rather than looking at Share of Shelf alone, compare it with the number of recommended products and Average Position to understand how each merchant earns its recommendation visibility.

Understanding what drives a merchant’s visibility
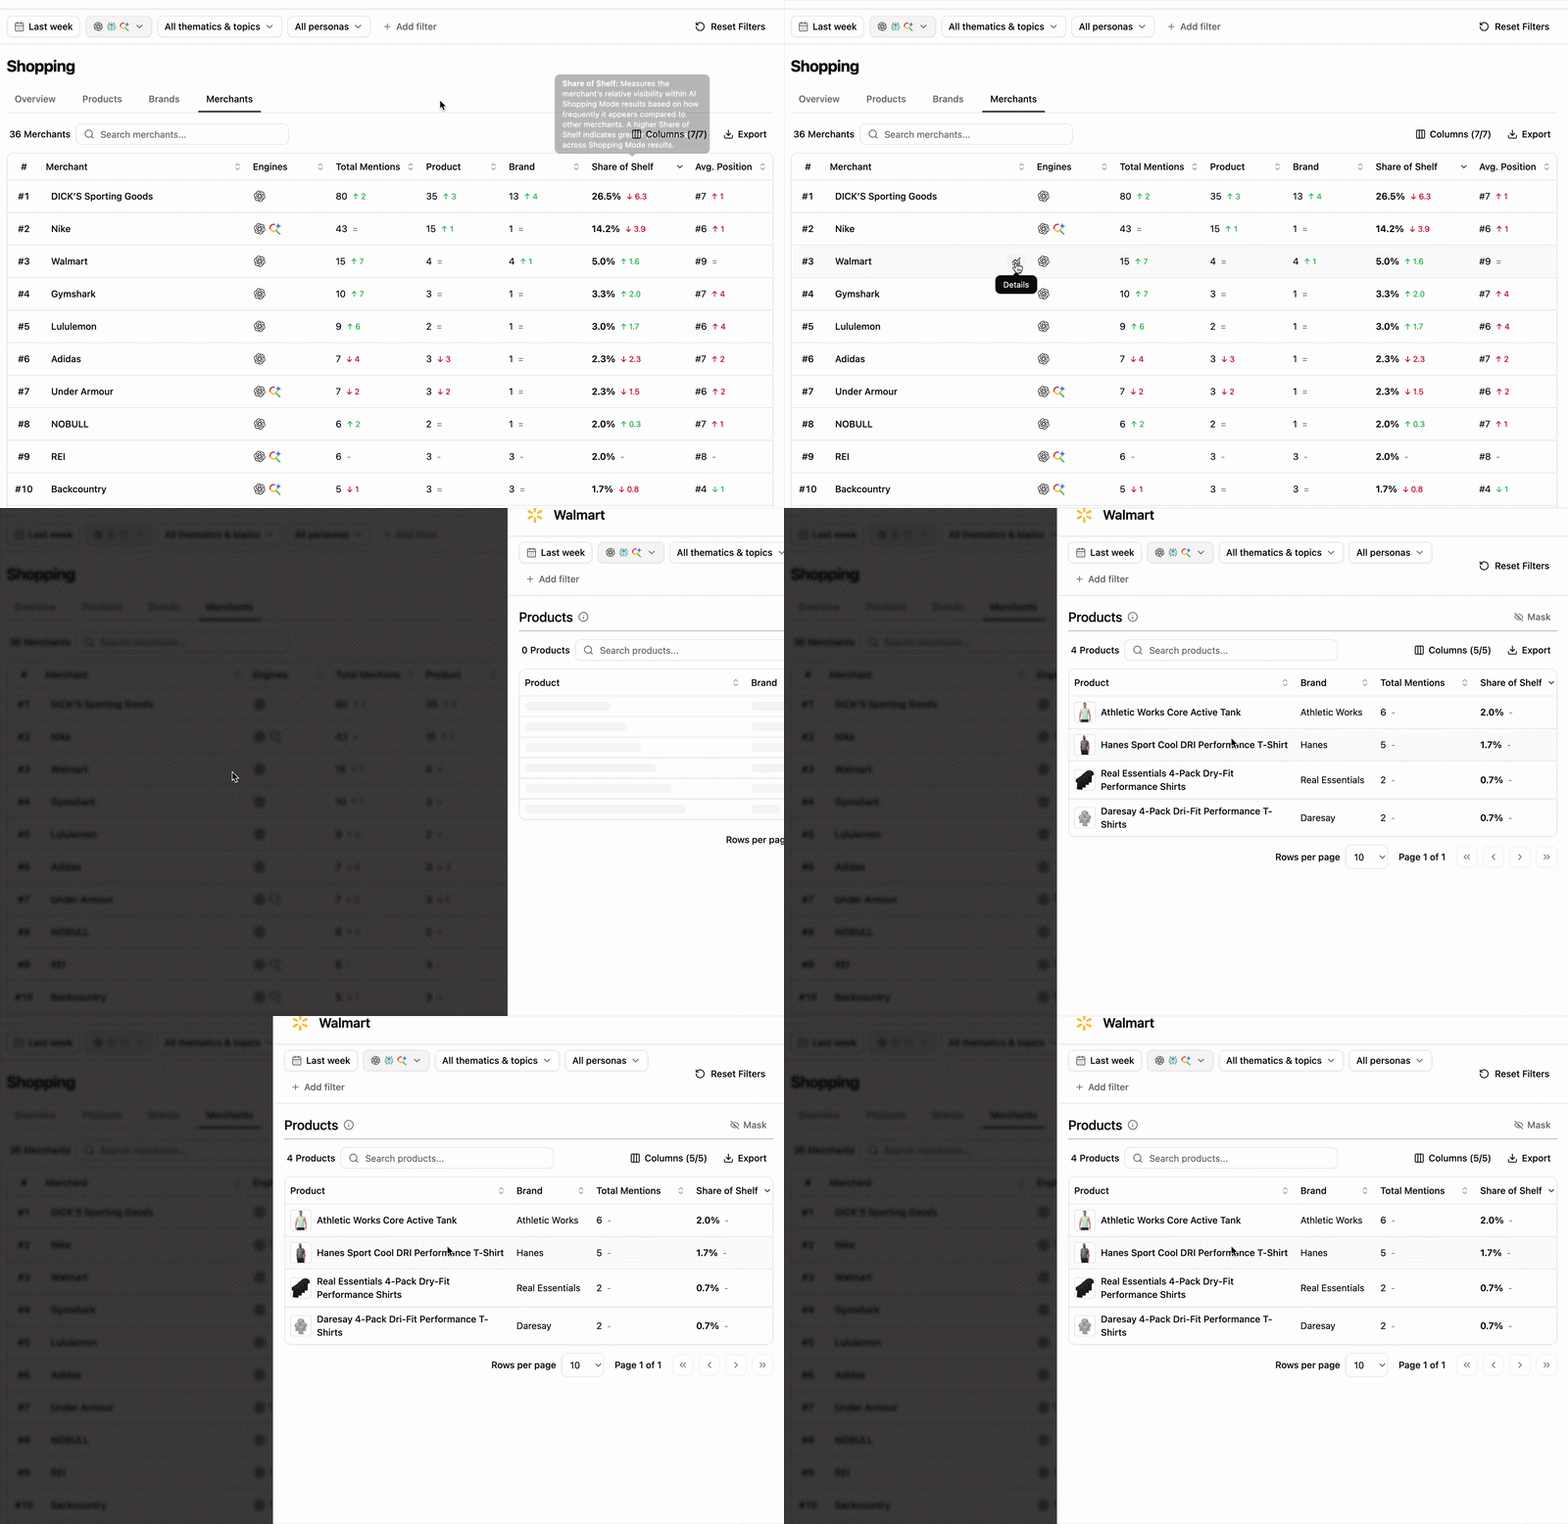
Shopping Merchants Details
Selecting a merchant opens its detailed view, listing every product contributing to its recommendation visibility. This allows you to understand:
  • which products generate most of the merchant’s Share of Shelf,
  • whether visibility depends on a few flagship products,
  • how recommendation visibility is distributed across the merchant’s catalogue,
  • which products drive the merchant’s commercial presence.
Looking at product contribution helps you understand which products drive a merchant’s visibility and whether its recommendation presence is built on a broad catalogue or a handful of key products.

Reading cues

These are signals to read, not rules.
The merchant is benefiting from a small number of highly recommended products. Its recommendation visibility may depend heavily on a handful of best-performing offers.
The merchant’s presence is concentrated around a single high-performing product. Understanding this dependency helps assess whether its visibility is diversified or concentrated.
Your brand may be well represented in AI recommendations while a competing retailer receives most of the commercial exposure.Review the Merchant Details panel to understand which products contribute to that advantage.

How to use this view effectively

Begin by identifying the merchants occupying the largest share of the AI Shelf. Compare Share of Shelf, Average Position and Number of Products to understand whether recommendation visibility comes from a broad catalogue or from a few highly successful products.Then open Merchant Details to analyse which products contribute to each merchant’s visibility and understand how recommendation performance is distributed across their catalogue.Comparing merchants helps reveal which retailers benefit most from conversational AI recommendations and where commercial opportunities are concentrated.

Extra features

  • Filters — refine the data displayed.
  • Add/Hide columns — adapt the table to your workflow.
  • Export — extract filtered tables to CSV or Excel.
  • Search — find a brand or product via the search bar.
  • Sort — order by any column.

What’s next

Share of Shelf

Learn how recommendation visibility is measured and interpreted.

Products

Analyse which products AI shopping engines recommend.