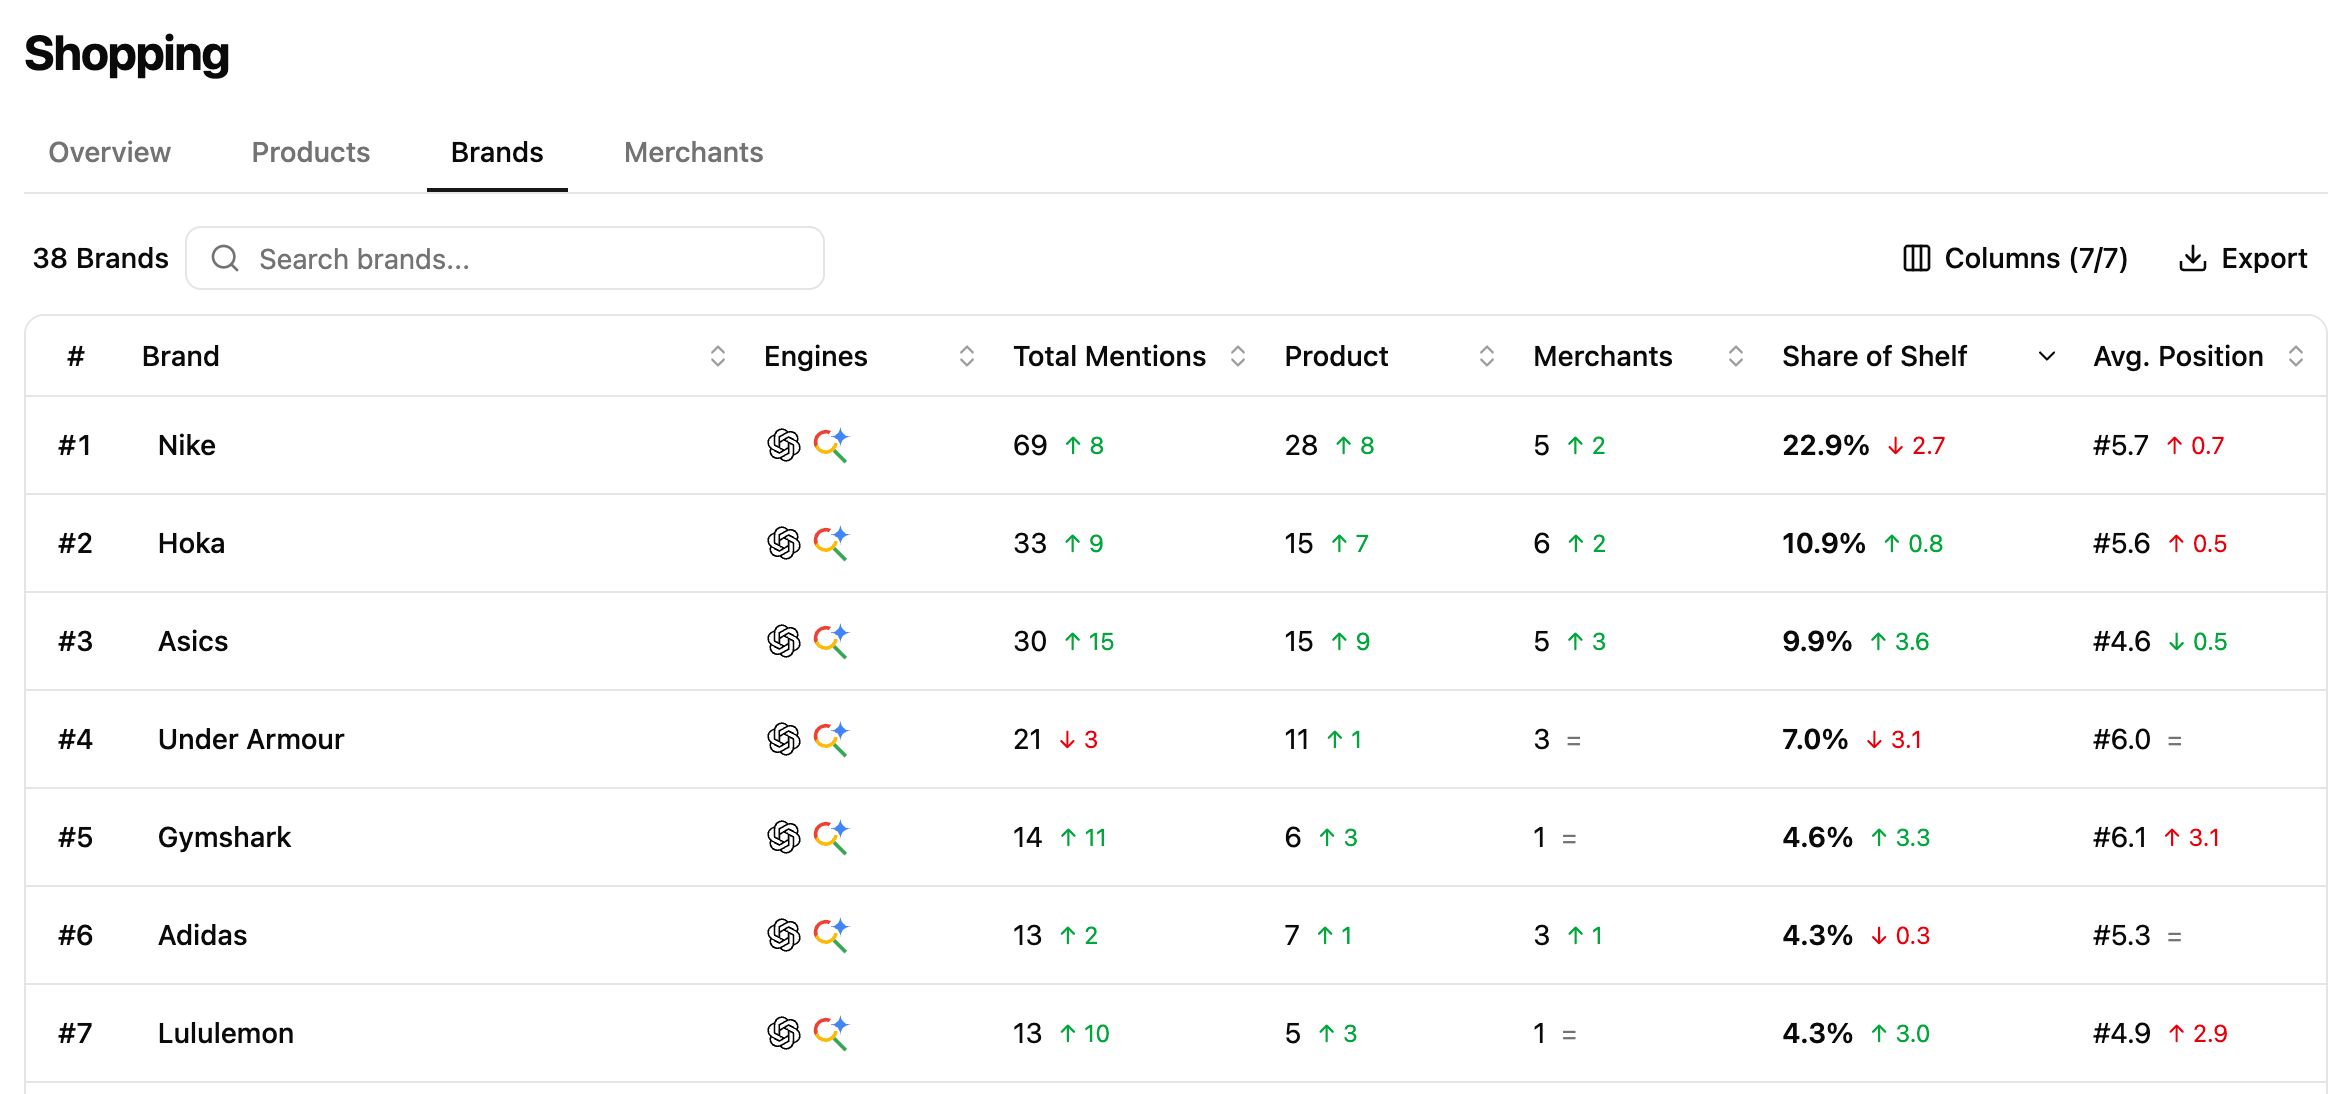
While conversational AI recommends products, those recommendations ultimately build brand visibility. A brand’s presence on the AI Shelf is the result of every product that AI chooses to recommend across your tracked shopping journeys. Some brands dominate because they consistently recommend a broad catalogue. Others rely on a handful of flagship products that capture most of their visibility. The Brands view helps you understand who occupies the AI Shelf, how recommendation visibility is distributed across competing brands, and which products contribute to that performance.

What this view helps you analyse

The Brands view helps answer questions such as:
  • Which brands dominate the AI Shelf?
  • Which brands receive the greatest Share of Shelf?
  • Which brands consistently appear at the top of shopping recommendations?
  • Which products contribute most to each brand’s visibility?
  • How concentrated or diversified is a brand’s recommendation portfolio?
  • Which competitors are gaining recommendation visibility over time?
This view provides the competitive perspective of your AI shopping ecosystem.

Comparing brand visibility

Screenshot 2026 07 27 At 16 39 54
Each row represents a brand identified across your tracked shopping placements. The table aggregates the visibility generated by all products belonging to that brand, allowing you to compare brands rather than individual SKUs. For each brand, you can analyse metrics such as:
  • Share of Shelf
  • Average Position
  • Number of recommended products
  • Recommendation frequency (Total Mentions)
Together, these metrics help distinguish brands that dominate recommendations through a broad catalogue from those driven by a smaller number of highly visible products.
Rather than looking at Share of Shelf alone, compare it with the number of recommended products to better understand how each brand builds its visibility.

Understanding what drives a brand’s visibility
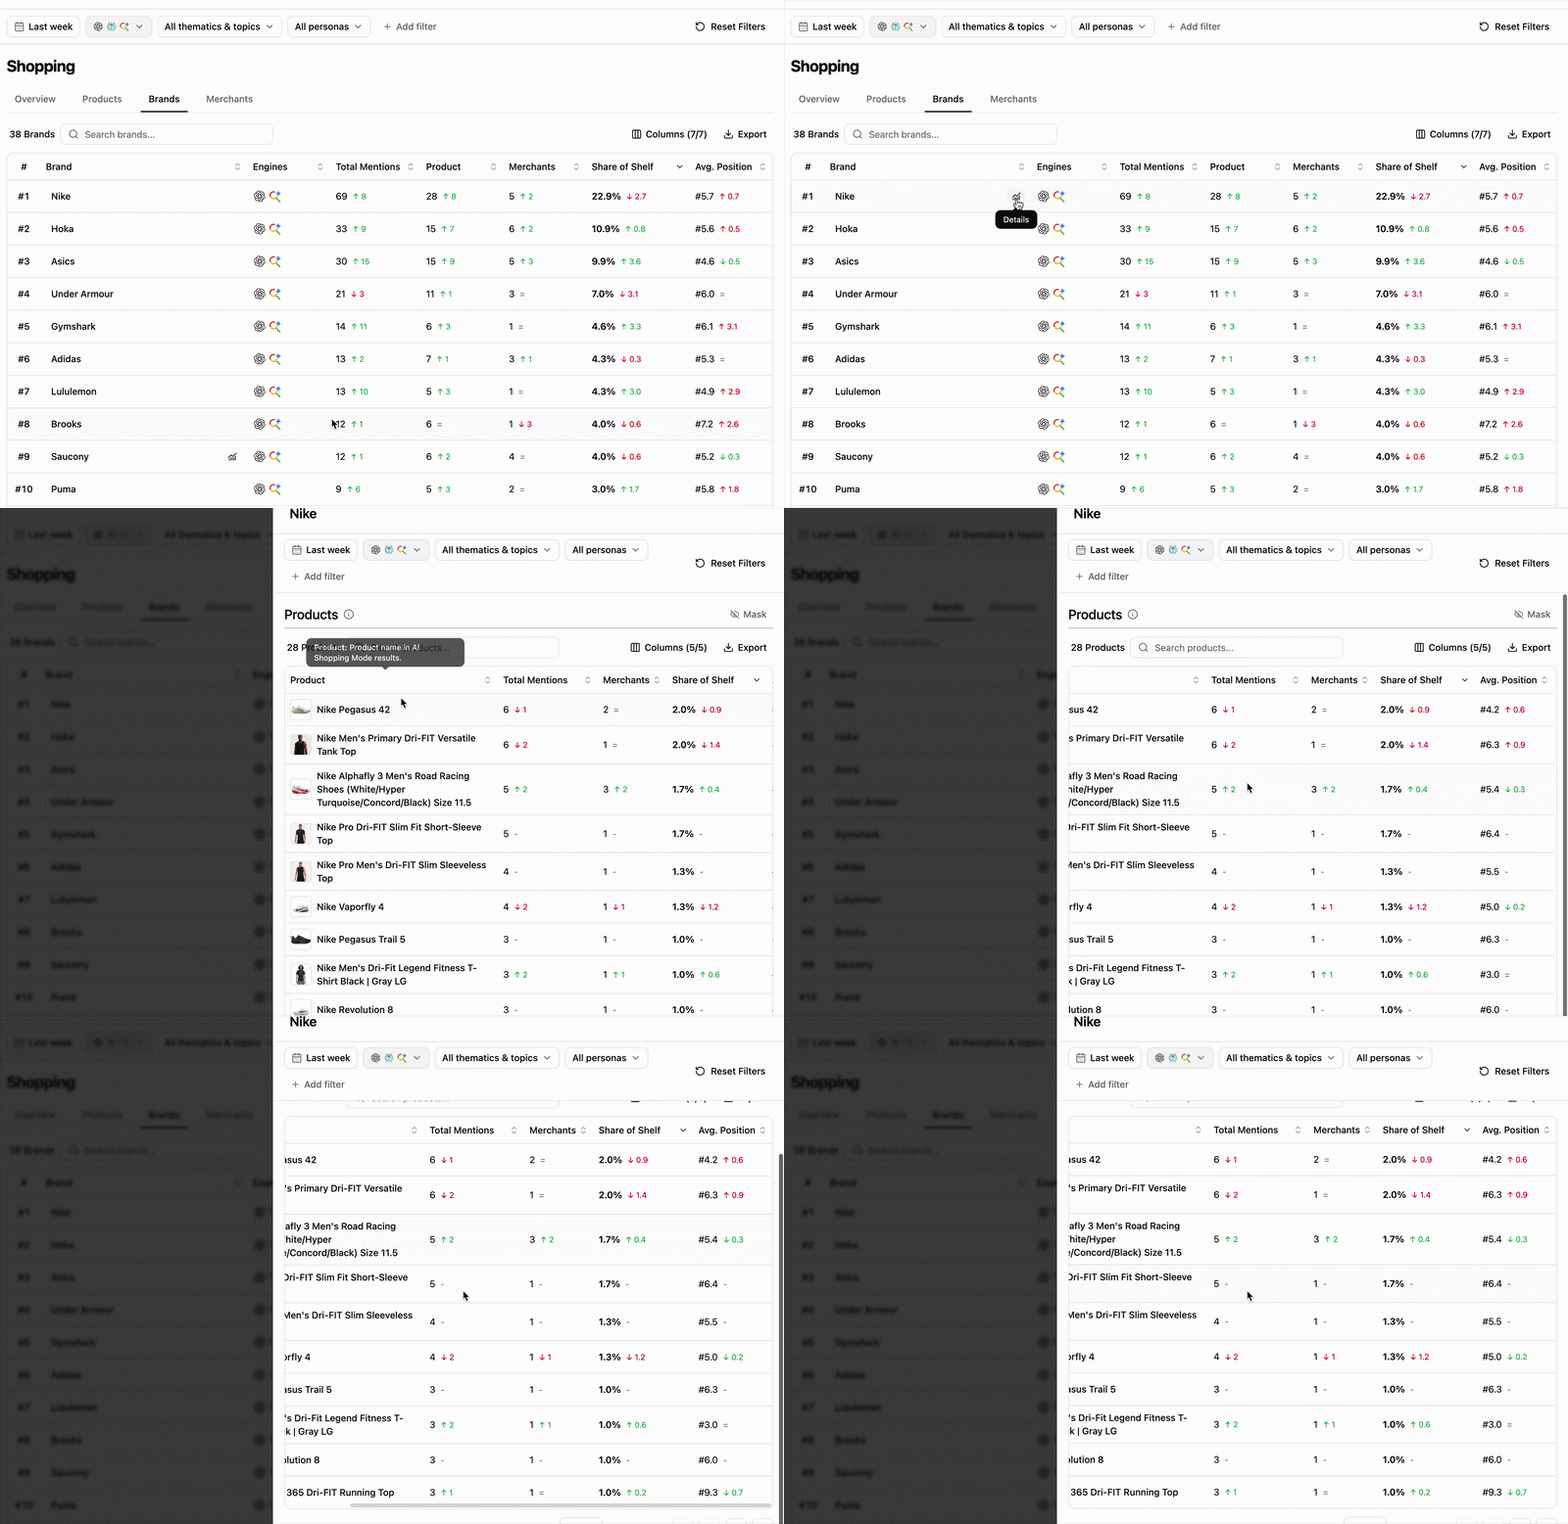
Shopping Brands Details
Selecting a brand opens its detailed view, listing every product contributing to its recommendation visibility. This allows you to understand:
  • which products generate most of the brand’s Share of Shelf,
  • whether visibility is concentrated around a flagship product,
  • whether recommendation visibility is distributed across a broad portfolio,
  • which products deserve further investigation.
This bridges the gap between brand performance and product performance.

Reading cues

These are signals to read, not rules.
The brand’s visibility is likely driven by a small number of highly recommended products rather than a broad catalogue.Investigating those flagship products can help explain the brand’s performance.
The brand may depend heavily on a single hero product.This creates both an opportunity and a potential concentration risk if recommendation patterns change.

How to use this view effectively

Begin by identifying the brands occupying the largest share of the AI Shelf. Compare Share of Shelf, Average Position and Number of Products to understand whether visibility comes from catalogue breadth or from a few highly successful products.Then, open Brand Details to analyse the products driving each brand’s visibility and understand how recommendation performance is distributed across the portfolio.

Extra features

  • Filters — refine the data displayed.
  • Add/Hide columns — adapt the table to your workflow.
  • Export — extract filtered tables to CSV or Excel.
  • Search — find a brand or product via the search bar.
  • Sort — order by any column.

What’s next

Share of Shelf

Learn how recommendation visibility is measured and interpreted.

Merchants

Identify which retailers benefit from those recommendations.