> ## Documentation Index
> Fetch the complete documentation index at: https://docs.shareofmodel.ai/llms.txt
> Use this file to discover all available pages before exploring further.
# Products
> Understand which products AI shopping engines recommend, how visible they are across your tracked prompts, and which merchants contribute to their visibility.
In conversational shopping experiences, **products become the primary unit of recommendation**.
When users ask for buying advice, AI assistants increasingly select and compare specific products. The same product may appear across multiple prompts, engines and merchants, sometimes with different prices, ratings or review counts.
The Products view helps you understand **which products occupy the AI Shelf**, how prominently they are recommended, and under which shopping needs they perform best.
## What this view helps you analyse
The Products view helps answer questions such as:
* Which products receive the greatest recommendation visibility?
* Which products achieve the strongest Share of Shelf and Average Position?
* Under which themes and topics does each product perform best?
* What price range is displayed for a product across AI responses?
* How consistent are its displayed ratings?
* What is the highest review count surfaced by the LLMs?
* Which merchants contribute to its visibility?
This is the main view for identifying the products driving your AI shopping presence—and comparing them with competing alternatives.
Products are grouped so that variations of the same item such as colour or size options, are not necessarily treated as separate products.
### Comparing product visibility
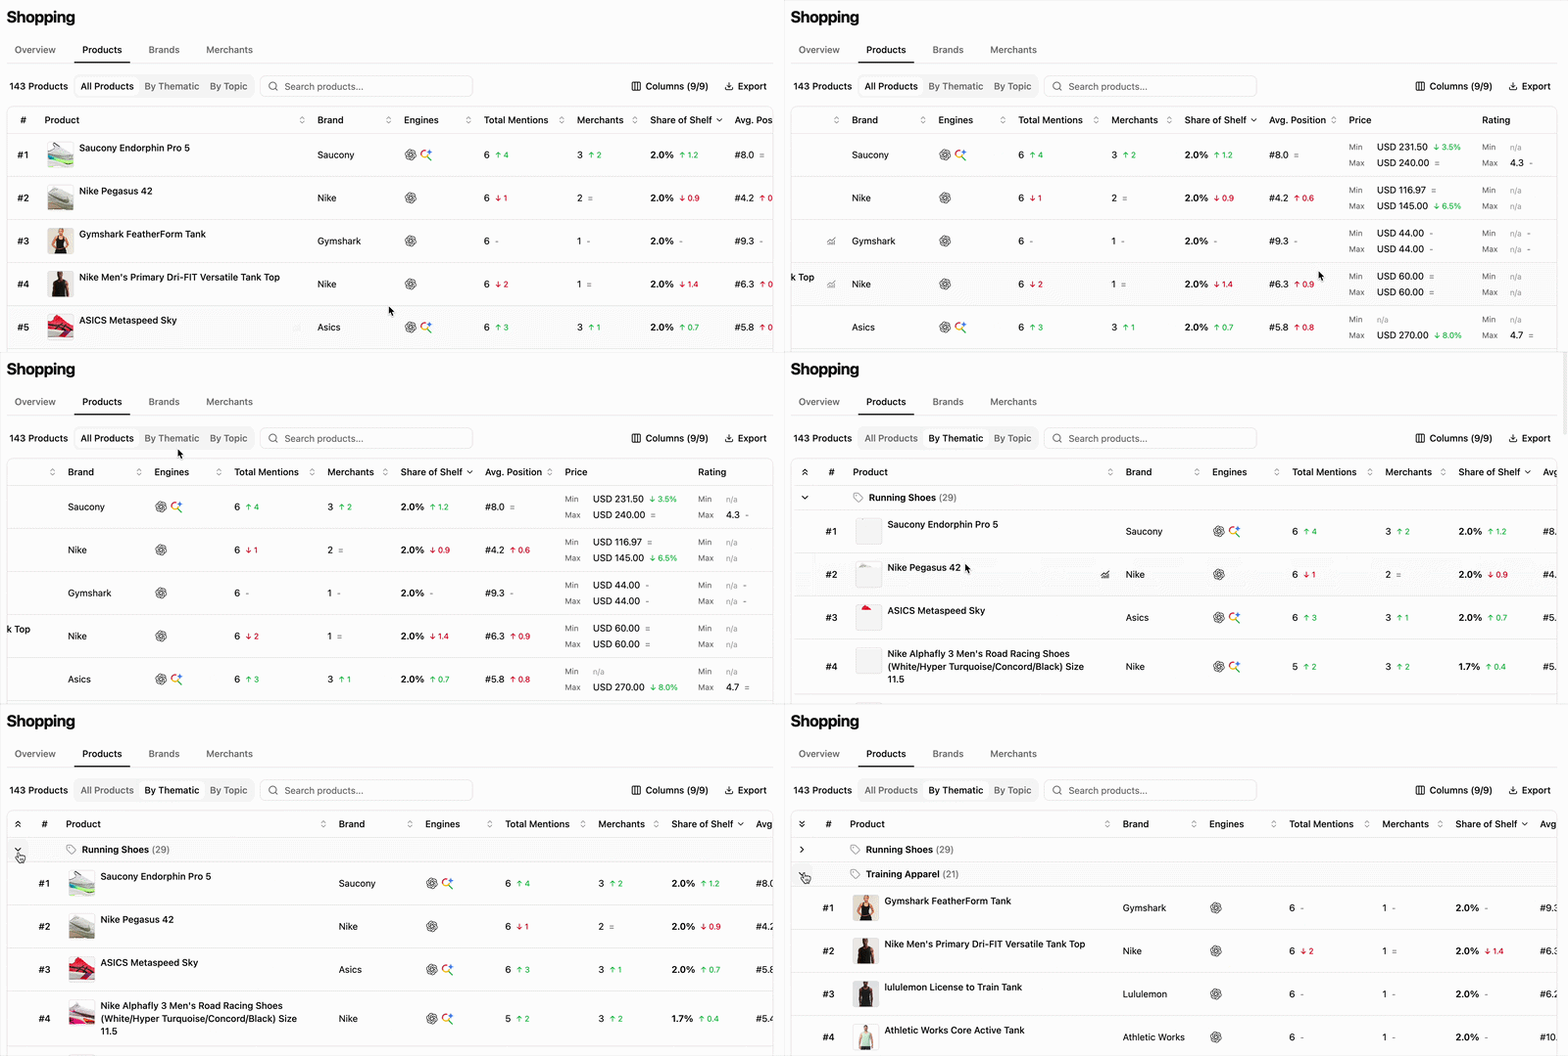 Each row represents a distinct product identified across your tracked prompts.
The table combines visibility metrics with the product information displayed by AI shopping engines.
Depending on the selected scope, you can analyse:
* **Share of Shelf:** the product's share of all observed shopping placements.
* **Average Position:** the average position at which the product appears.
* **Minimum and maximum displayed price:** the lowest and highest prices surfaced for the product.
* **Minimum and maximum rating:** the range of ratings displayed across recommendations.
* **Maximum number of reviews:** the highest review count displayed for the product.
These values are aggregated from the information surfaced by the LLMs.
Prices, ratings and review counts may vary between engines, merchants and collection periods. The ranges shown in the table reflect what users could encounter within the analysed AI responses.
### Analysing products by thematic and topic
The Products view can be grouped by **Thematic** and **Topic** to reveal how recommendation performance changes across different shopping needs.
This moves the analysis beyond a single category-wide ranking.
A product that appears dominant overall may perform particularly well within one thematic area, while a competing product may lead for a more specific topic or purchase intent.
Grouping the view helps you identify:
* the leading products for each thematic area,
* the products associated with specific user needs,
* differences between broad category visibility and topic-level performance,
* gaps where your products are absent from relevant shopping conversations.
This is especially useful when the same product portfolio addresses several audiences, use cases or stages of the purchase journey.
### Understanding displayed product information
The commercial information displayed alongside a product may change from one result to another. For that reason, the Products view uses ranges and maximum values rather than averages.
#### Price range
The minimum and maximum values show the range of prices displayed for the product across the analysed shopping placements.
A wide range may reflect different merchants, variants, promotional offers or inconsistencies in the information surfaced by AI engines.
#### Rating range
The minimum and maximum values indicate how ratings vary across the observed recommendations.
A narrow range suggests relatively consistent product information, while a wider range may indicate differences between merchants or source data.
#### Maximum number of reviews
The maximum review count represents the highest number of reviews displayed for the product.
This avoids averaging review counts collected from different merchants or sources, which would not necessarily represent a meaningful product-level value.
### Understanding merchant distribution
Each row represents a distinct product identified across your tracked prompts.
The table combines visibility metrics with the product information displayed by AI shopping engines.
Depending on the selected scope, you can analyse:
* **Share of Shelf:** the product's share of all observed shopping placements.
* **Average Position:** the average position at which the product appears.
* **Minimum and maximum displayed price:** the lowest and highest prices surfaced for the product.
* **Minimum and maximum rating:** the range of ratings displayed across recommendations.
* **Maximum number of reviews:** the highest review count displayed for the product.
These values are aggregated from the information surfaced by the LLMs.
Prices, ratings and review counts may vary between engines, merchants and collection periods. The ranges shown in the table reflect what users could encounter within the analysed AI responses.
### Analysing products by thematic and topic
The Products view can be grouped by **Thematic** and **Topic** to reveal how recommendation performance changes across different shopping needs.
This moves the analysis beyond a single category-wide ranking.
A product that appears dominant overall may perform particularly well within one thematic area, while a competing product may lead for a more specific topic or purchase intent.
Grouping the view helps you identify:
* the leading products for each thematic area,
* the products associated with specific user needs,
* differences between broad category visibility and topic-level performance,
* gaps where your products are absent from relevant shopping conversations.
This is especially useful when the same product portfolio addresses several audiences, use cases or stages of the purchase journey.
### Understanding displayed product information
The commercial information displayed alongside a product may change from one result to another. For that reason, the Products view uses ranges and maximum values rather than averages.
#### Price range
The minimum and maximum values show the range of prices displayed for the product across the analysed shopping placements.
A wide range may reflect different merchants, variants, promotional offers or inconsistencies in the information surfaced by AI engines.
#### Rating range
The minimum and maximum values indicate how ratings vary across the observed recommendations.
A narrow range suggests relatively consistent product information, while a wider range may indicate differences between merchants or source data.
#### Maximum number of reviews
The maximum review count represents the highest number of reviews displayed for the product.
This avoids averaging review counts collected from different merchants or sources, which would not necessarily represent a meaningful product-level value.
### Understanding merchant distribution
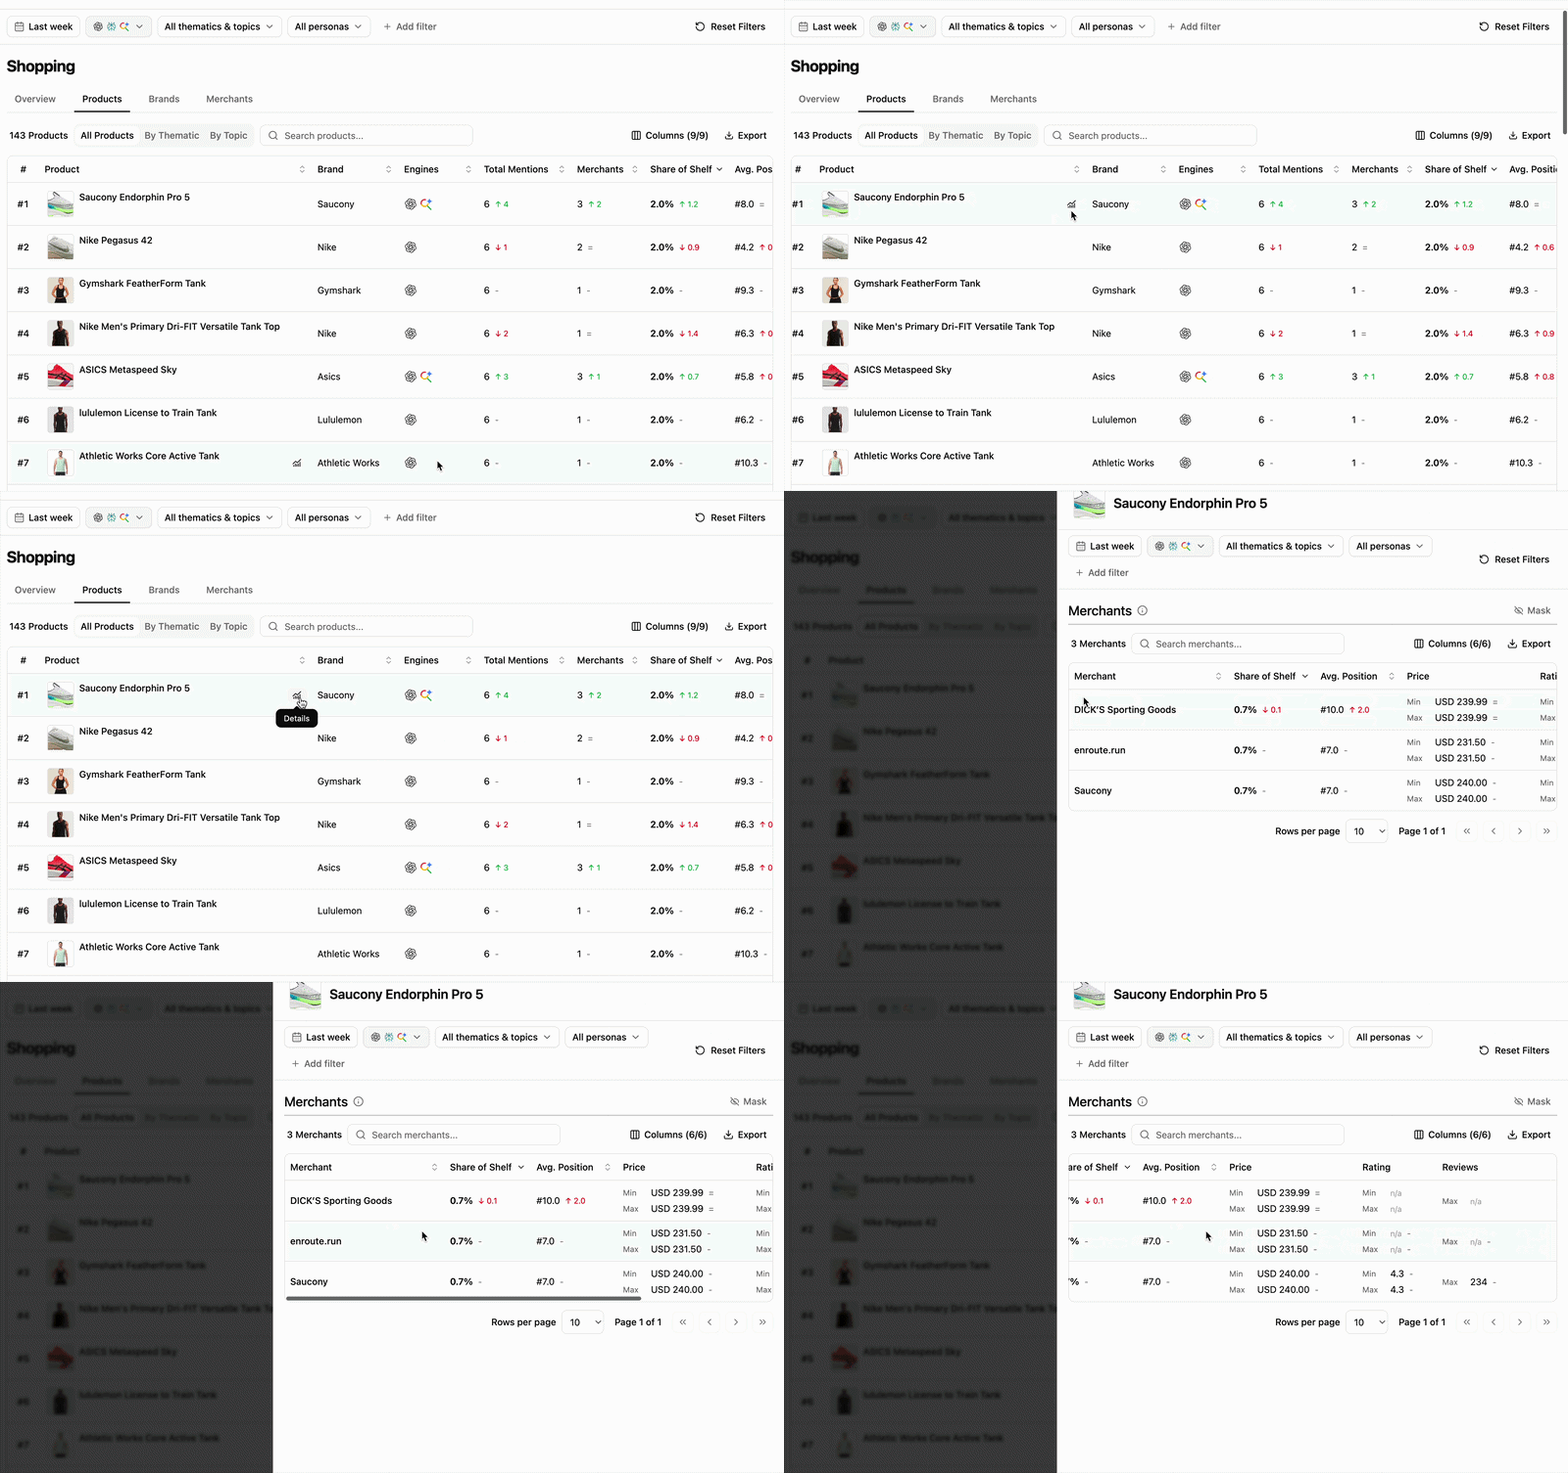 Selecting a product opens its detailed view and reveals the merchants associated with it.
This allows you to understand:
* which merchants contribute to the product's visibility,
* whether its recommendations are concentrated around one retailer,
* how Share of Shelf and Average Position differ by merchant,
* how the displayed price, rating and review count vary between offers.
The Product Details view connects **recommendation visibility** with **commercial availability**.
A product may perform strongly because it is consistently surfaced through one dominant merchant, or because it is widely available across several retailers.
## Reading cues
These are signals to read, not rules.
The product is not only present frequently; it is also consistently prioritised within shopping recommendations.
Its visibility may depend on a specific use case or purchase intent rather than broad category leadership.
This may reflect differences between merchants, product variants or offers surfaced by different engines.
Review the Product Details view before treating the range as a pricing issue.
The LLMs may be surfacing ratings from different merchants or underlying sources.
A wide range should therefore be interpreted as information variability, not necessarily as a change in customer satisfaction.
Strong review volume alone does not guarantee recommendation visibility. Other products may still be prioritised more frequently or placed higher by AI engines.
The product is performing well, but its recommendation presence may depend heavily on a single retailer.
This can reveal both a distribution advantage and a concentration risk.
This identifies a more actionable gap than the overall product ranking alone.
Investigate the prompts and merchants contributing to that competitor's topic-level performance.
## How to use this view effectively
Start with the ungrouped table to identify the products occupying the largest share of the AI Shelf. Compare **Share of Shelf** with **Average Position** to distinguish frequent recommendations from prominent ones.
Then group the table by **Thematic** and **Topic** to understand where each product performs best, identify intent-level gaps that may be hidden by the overall ranking and detect variation in the commercial information surfaced by AI engines.
Finally, open Product Details to understand which merchants contribute to the product's visibility and how its offers differ across the shopping ecosystem.
## Extra features
* **Filters** — refine the data displayed.
* **Add/Hide columns** — adapt the table to your workflow.
* **Export** — extract filtered tables to CSV or Excel.
* **Search** — find a brand or product via the search bar.
* **Sort** — order by any column.
## What's next
Learn how product recommendation visibility is measured and interpreted.
Analyse which brands dominate recommendations.
Selecting a product opens its detailed view and reveals the merchants associated with it.
This allows you to understand:
* which merchants contribute to the product's visibility,
* whether its recommendations are concentrated around one retailer,
* how Share of Shelf and Average Position differ by merchant,
* how the displayed price, rating and review count vary between offers.
The Product Details view connects **recommendation visibility** with **commercial availability**.
A product may perform strongly because it is consistently surfaced through one dominant merchant, or because it is widely available across several retailers.
## Reading cues
These are signals to read, not rules.
The product is not only present frequently; it is also consistently prioritised within shopping recommendations.
Its visibility may depend on a specific use case or purchase intent rather than broad category leadership.
This may reflect differences between merchants, product variants or offers surfaced by different engines.
Review the Product Details view before treating the range as a pricing issue.
The LLMs may be surfacing ratings from different merchants or underlying sources.
A wide range should therefore be interpreted as information variability, not necessarily as a change in customer satisfaction.
Strong review volume alone does not guarantee recommendation visibility. Other products may still be prioritised more frequently or placed higher by AI engines.
The product is performing well, but its recommendation presence may depend heavily on a single retailer.
This can reveal both a distribution advantage and a concentration risk.
This identifies a more actionable gap than the overall product ranking alone.
Investigate the prompts and merchants contributing to that competitor's topic-level performance.
## How to use this view effectively
Start with the ungrouped table to identify the products occupying the largest share of the AI Shelf. Compare **Share of Shelf** with **Average Position** to distinguish frequent recommendations from prominent ones.
Then group the table by **Thematic** and **Topic** to understand where each product performs best, identify intent-level gaps that may be hidden by the overall ranking and detect variation in the commercial information surfaced by AI engines.
Finally, open Product Details to understand which merchants contribute to the product's visibility and how its offers differ across the shopping ecosystem.
## Extra features
* **Filters** — refine the data displayed.
* **Add/Hide columns** — adapt the table to your workflow.
* **Export** — extract filtered tables to CSV or Excel.
* **Search** — find a brand or product via the search bar.
* **Sort** — order by any column.
## What's next
Learn how product recommendation visibility is measured and interpreted.
Analyse which brands dominate recommendations.