> ## Documentation Index
> Fetch the complete documentation index at: https://docs.shareofmodel.ai/llms.txt
> Use this file to discover all available pages before exploring further.
# Fan-out Queries
> Inspect the internal queries LLMs use to build their answers and where your domain fits in.
To build a response, models often generate multiple internal queries — known as **fan-out queries** — to explore a topic before producing the final answer. These internal queries largely determine which angles of the topic are explored, which domains and URLs are retrieved, and whether your domain or brand later appears as a **Source** or a **Link**.
The **Fan-out Queries** view exposes this internal exploration so you can understand how generative answers are actually constructed.
Read [What is query fan-out and why it matters in LLM search](/platform/search/what-is-query-fan-out-and-why-it-matters-in-llm-search) for the conceptual primer.
## What this view helps you analyse
The view bridges LLM reasoning and search visibility signals by showing:
* how LLMs decompose a prompt into multiple internal queries,
* how stable or volatile these fan-out queries are,
* how engines differ in fan-out behaviour,
* how your domain and competitors are positioned within this fan-out layer.
### Identify global fan-out patterns
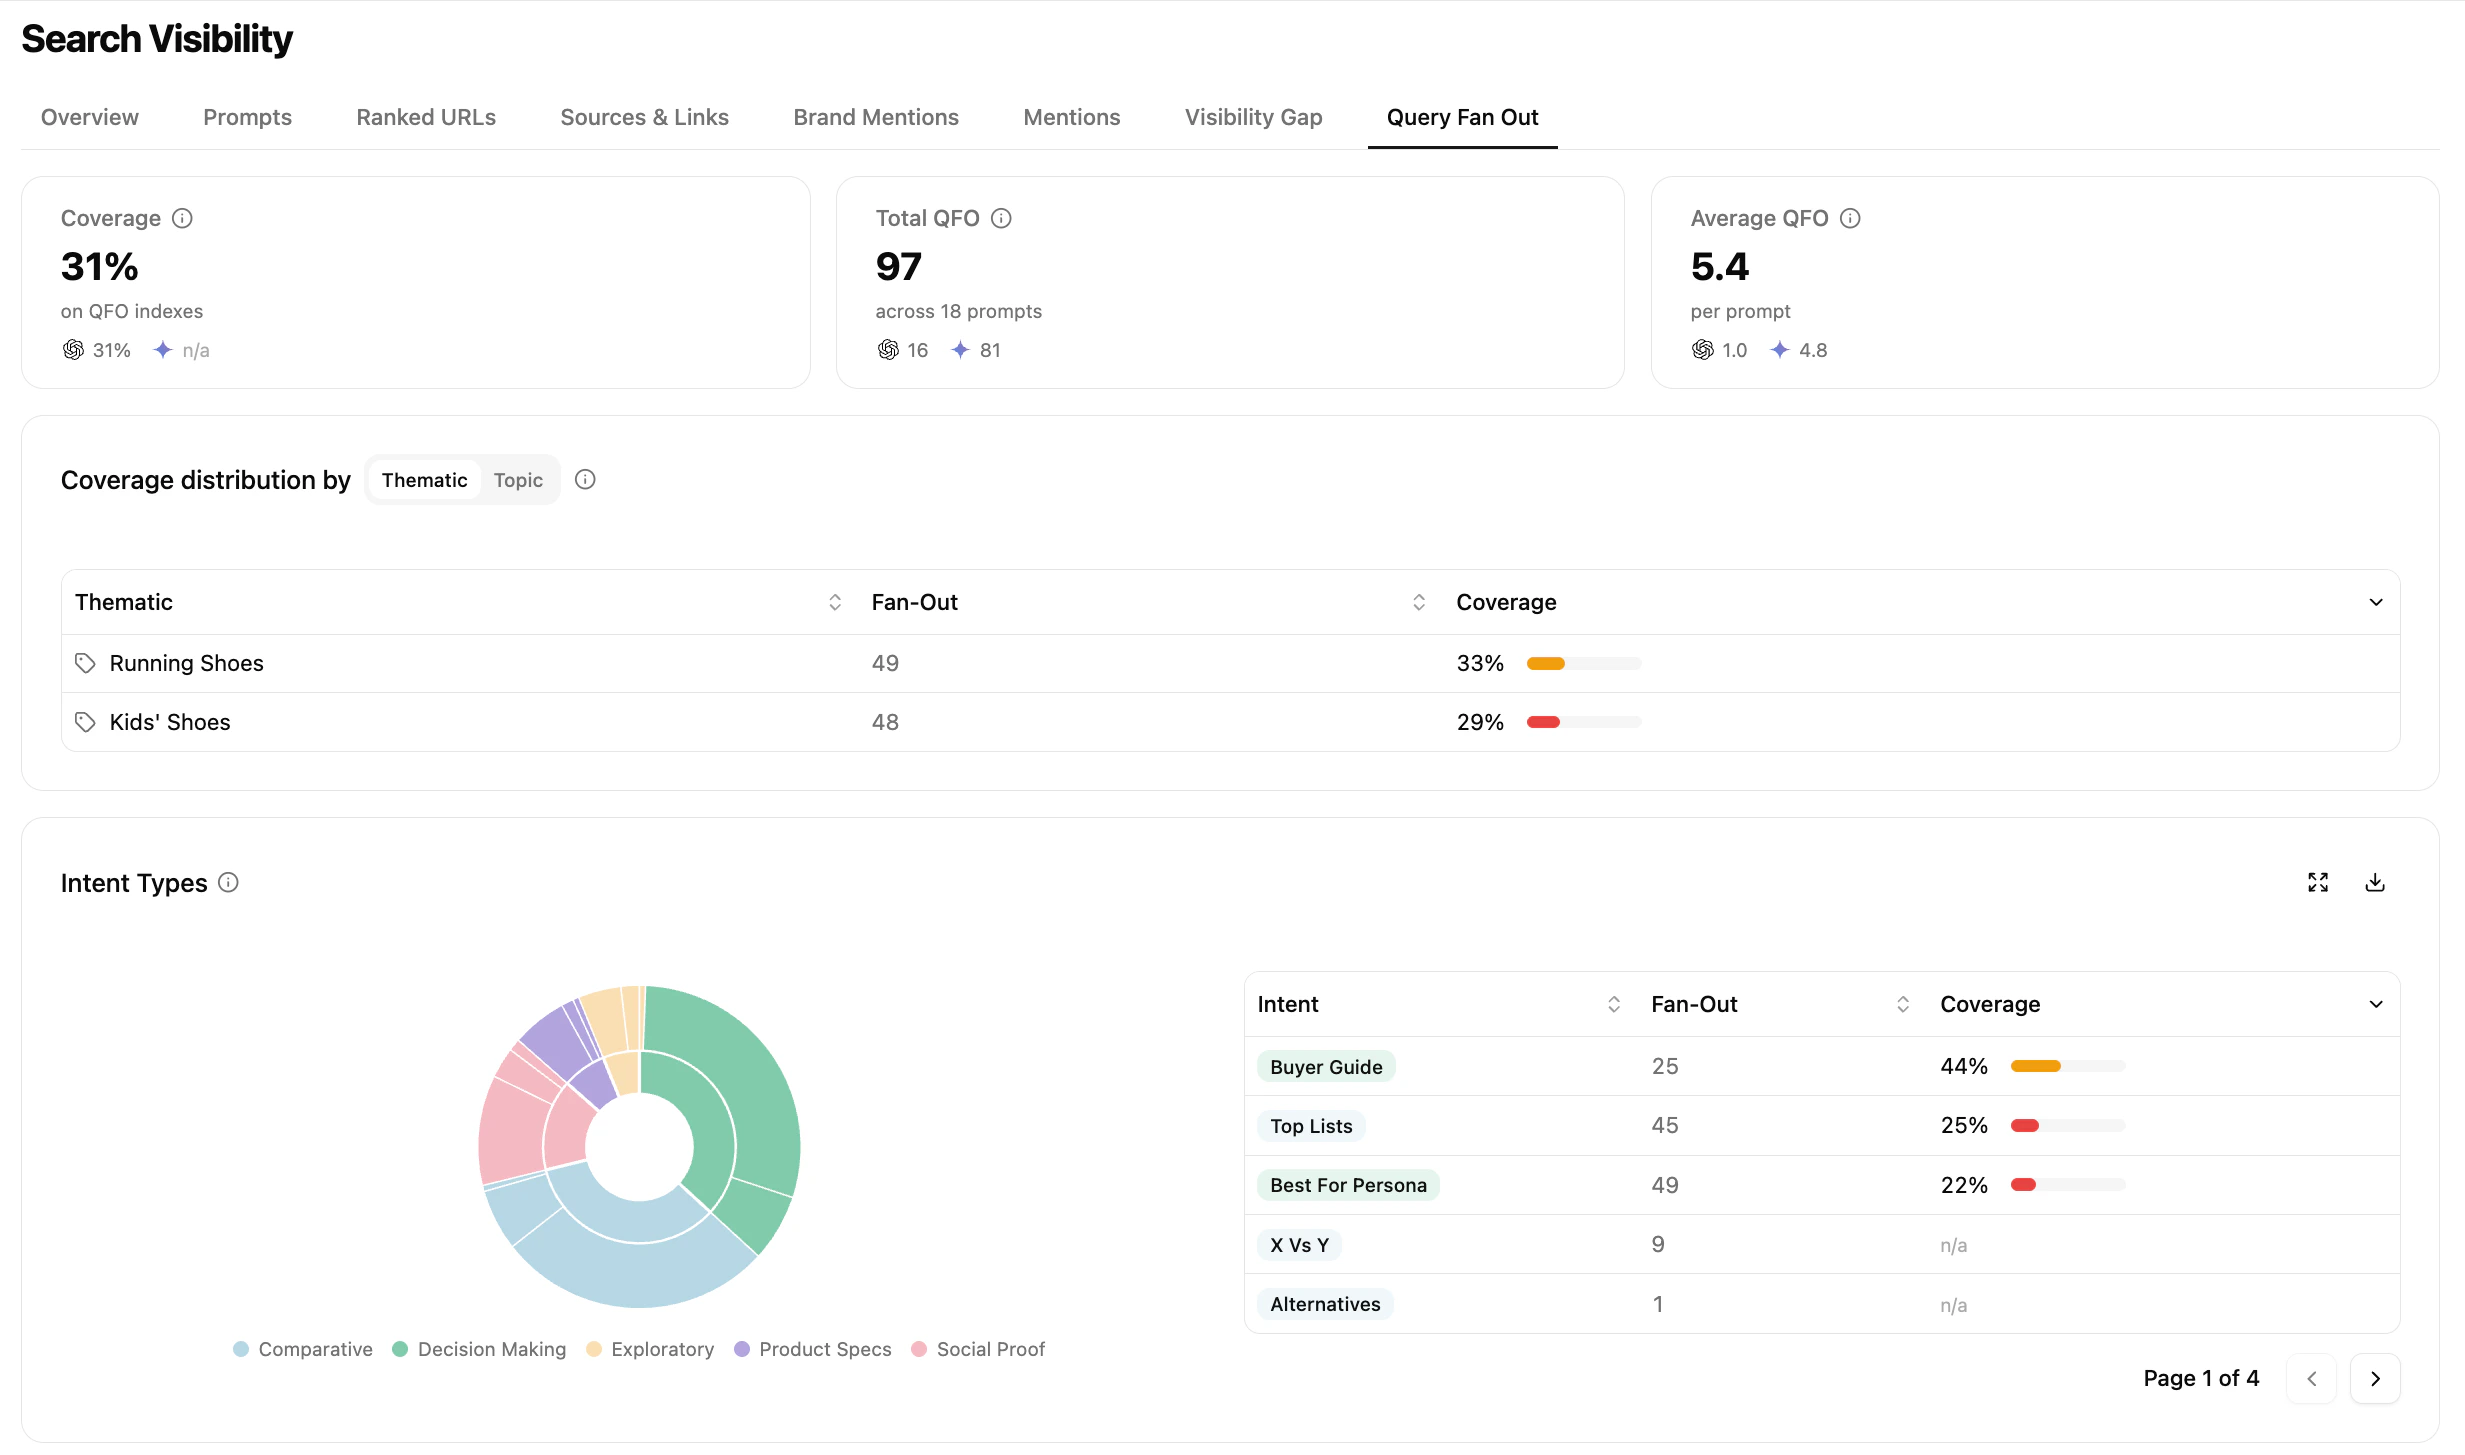 The Overview surfaces high-level patterns across fan-out queries:
* **Coverage** — percentage of fan-out queries where your domain is present when URLs are retrieved
* **Total QFO** — total number of fan-out queries generated across tracked prompts
* **Average QFO** — average number of fan-out queries per prompt, by engine
You can also break coverage down by **thematic / topic** and by **intent type** (exploratory, comparative, decision-making, etc.).
This view answers questions like:
* How broad is the fan-out explored by the model?
* On which topics or intent types is my coverage stronger or weaker?
* Do different engines behave differently at a high level?
### Analyse individual fan-out queries
The Overview surfaces high-level patterns across fan-out queries:
* **Coverage** — percentage of fan-out queries where your domain is present when URLs are retrieved
* **Total QFO** — total number of fan-out queries generated across tracked prompts
* **Average QFO** — average number of fan-out queries per prompt, by engine
You can also break coverage down by **thematic / topic** and by **intent type** (exploratory, comparative, decision-making, etc.).
This view answers questions like:
* How broad is the fan-out explored by the model?
* On which topics or intent types is my coverage stronger or weaker?
* Do different engines behave differently at a high level?
### Analyse individual fan-out queries
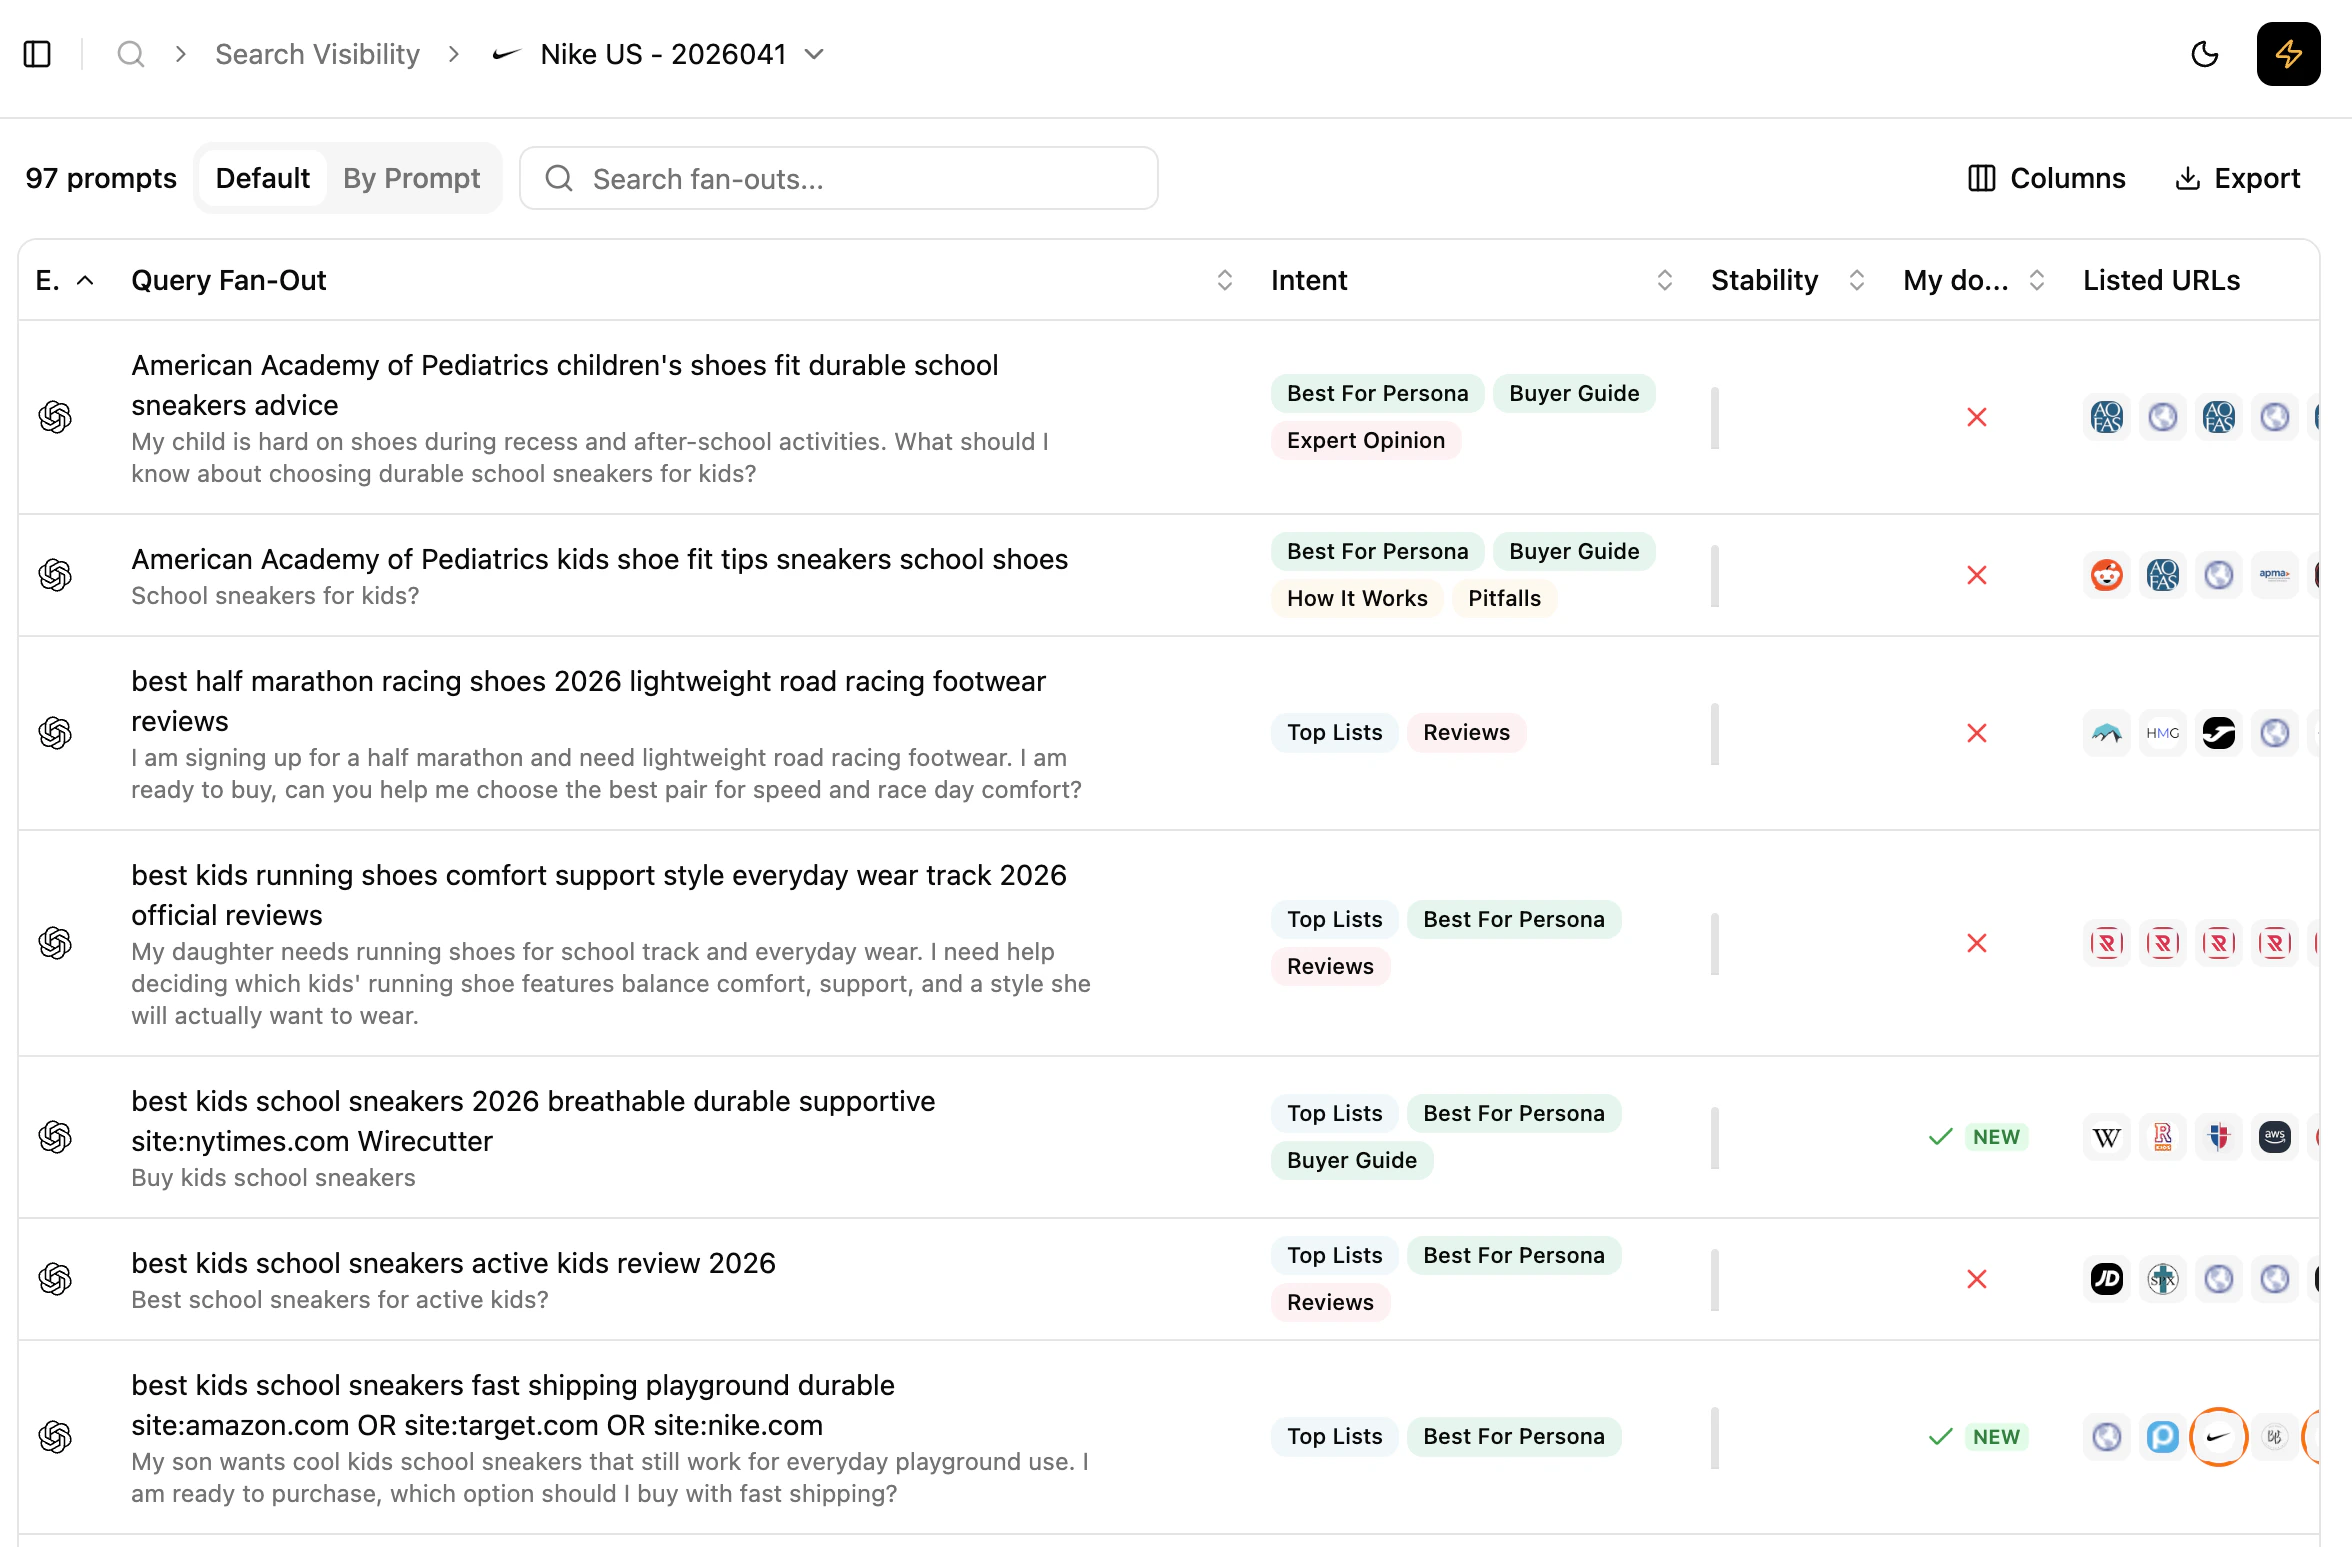 Scroll down to the detailed list, displayed either flat (`Grouped by: default`) or grouped by prompt for cross-engine comparison. For each fan-out query you see:
* the fan-out query itself
* its associated **intents**
* its **stability** over the last 12 collects (one bar per collect where the fan-out was present)
* whether your domain is present in the listed URLs
* the full list of URLs, ordered as returned by the API
You can:
* understand which internal queries the model relies on repeatedly,
* distinguish structural fan-out queries from occasional ones,
* observe relative positioning vs. competitors within a single fan-out.
Depending on the model and API capabilities, fan-out visibility may be partial. It reflects the retrievable part of the model's exploration, not its full internal reasoning.
### Understand how a single prompt is decomposed
Scroll down to the detailed list, displayed either flat (`Grouped by: default`) or grouped by prompt for cross-engine comparison. For each fan-out query you see:
* the fan-out query itself
* its associated **intents**
* its **stability** over the last 12 collects (one bar per collect where the fan-out was present)
* whether your domain is present in the listed URLs
* the full list of URLs, ordered as returned by the API
You can:
* understand which internal queries the model relies on repeatedly,
* distinguish structural fan-out queries from occasional ones,
* observe relative positioning vs. competitors within a single fan-out.
Depending on the model and API capabilities, fan-out visibility may be partial. It reflects the retrievable part of the model's exploration, not its full internal reasoning.
### Understand how a single prompt is decomposed
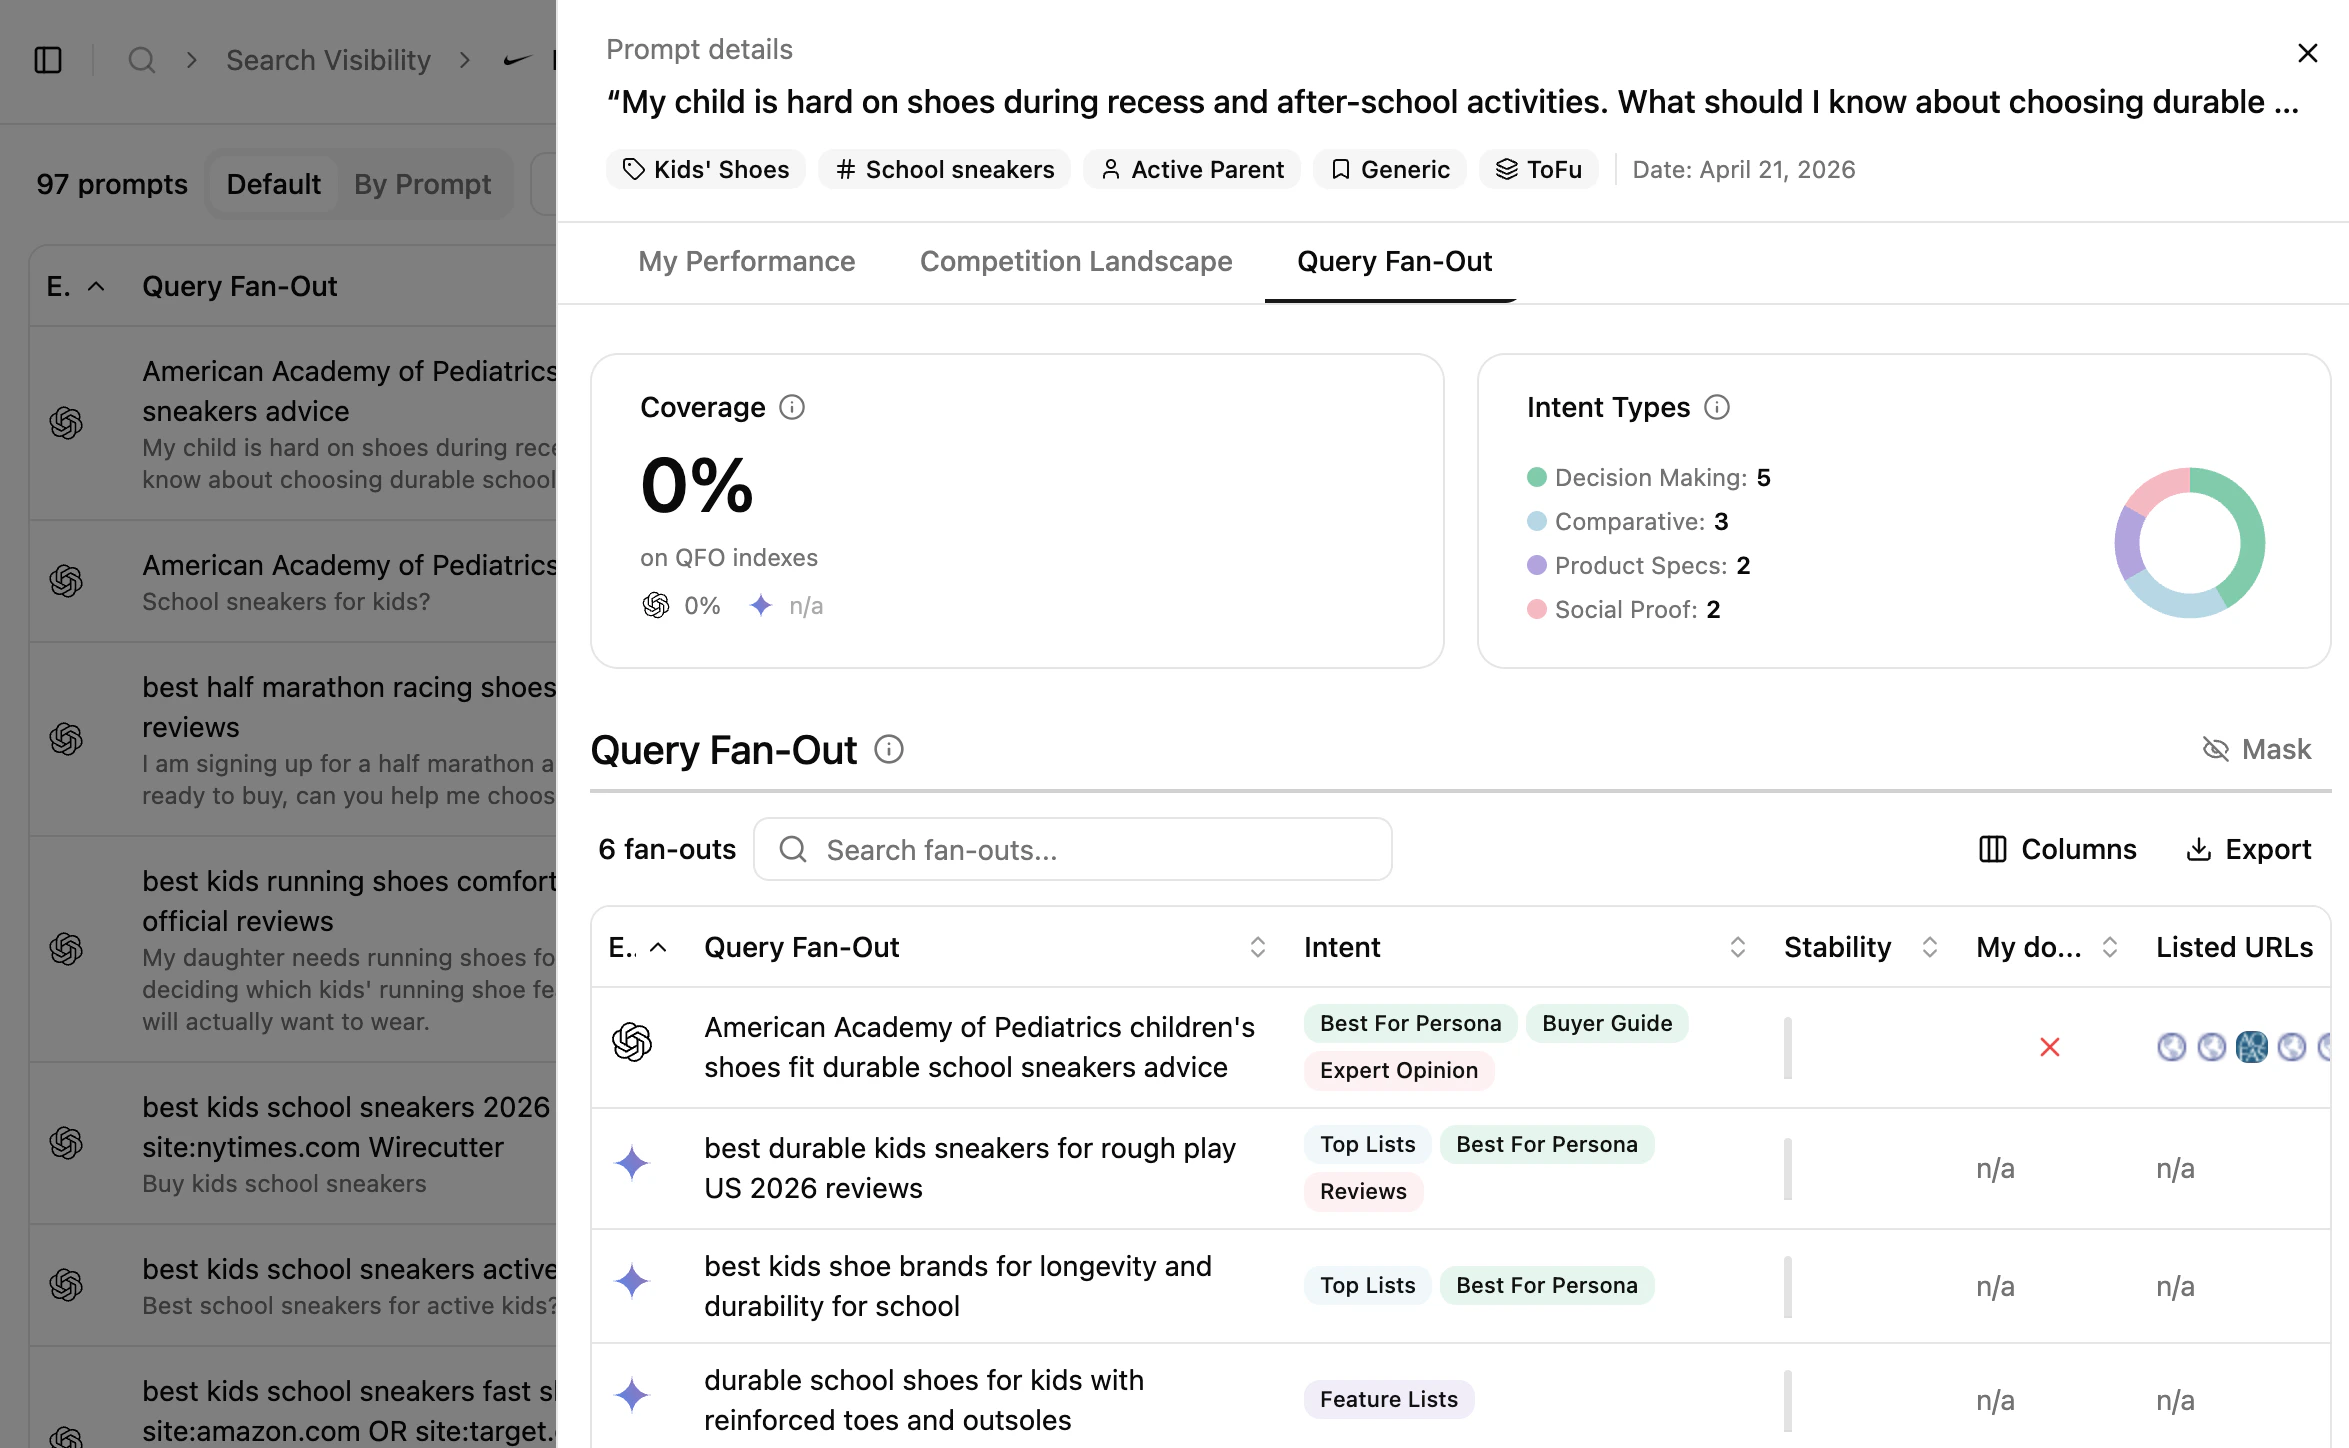 From the **Rankings** or **Prompts** views you can drill into fan-out details for a specific prompt. This shows how a single prompt is broken down, which fan-out types the model prioritises, and how your presence varies across these internal queries.
## Reading cues
These are signals to read, not rules.
* Fan-out queries that are stable over time often reflect **core questions** the model consistently asks itself.
* Differences across engines highlight **engine-specific reasoning strategies**.
* Fan-out queries where competitors are consistently present help explain **why certain domains repeatedly influence answers**.
* Recurring fan-out queries can be read as indicators of topics the model expects to find content about.
Fan-out data should be read as a map of the model's internal exploration — not a traditional ranking report.
## How to use this view effectively
Start by identifying fan-out queries that appear consistently across engines and collects. These recurring queries reflect the core questions the model relies on to determine which domains influence the final answer.
## What's next
Conceptual primer on fan-out behaviour.
See how fan-out outcomes turn into sources and links.
From the **Rankings** or **Prompts** views you can drill into fan-out details for a specific prompt. This shows how a single prompt is broken down, which fan-out types the model prioritises, and how your presence varies across these internal queries.
## Reading cues
These are signals to read, not rules.
* Fan-out queries that are stable over time often reflect **core questions** the model consistently asks itself.
* Differences across engines highlight **engine-specific reasoning strategies**.
* Fan-out queries where competitors are consistently present help explain **why certain domains repeatedly influence answers**.
* Recurring fan-out queries can be read as indicators of topics the model expects to find content about.
Fan-out data should be read as a map of the model's internal exploration — not a traditional ranking report.
## How to use this view effectively
Start by identifying fan-out queries that appear consistently across engines and collects. These recurring queries reflect the core questions the model relies on to determine which domains influence the final answer.
## What's next
Conceptual primer on fan-out behaviour.
See how fan-out outcomes turn into sources and links.