> ## Documentation Index
> Fetch the complete documentation index at: https://docs.shareofmodel.ai/llms.txt
> Use this file to discover all available pages before exploring further.
# Executive Dashboard
> Consolidated executive view of AI performance from your Search Visibility analyses.
The **Dashboard** is a module designed to provide a consolidated, executive view of AI performance, surfaced from your Search Visibility analyses.
## Key capabilities
Benchmark LLM visibility by brand, product category and global market.
A single view of the three pillars of AI presence: **Visibility**, **Perception** and **Influence**.
Identify performance gaps and high-priority opportunities before they impact market share.
Pre-activation decision-making backed by data from live search results.
## Metrics
| Metric | Definition |
| ------------------------------- | -------------------------------------------------------------------------------------------------------------------------------------------------------------------------------- |
| **Visibility Score** | Score based on top-position ranks and presence across search results. The greater the presence and the higher the position of a domain or brand, the closer the score is to 100. |
| **Brand Mention Presence Rate** | Percentage of prompt results in which a specific brand is ranked. |
| **Domain Presence Rate** | Percentage of prompt results in which a specific domain is ranked as a link. |
| **Sentiment Score** | Score from -100 to +100 indicating whether sources mention brands in a positive, neutral or negative context. |
| **Average Position** | Average positioning of your domain across analysed search experiences. |
## Charts
### Category Visibility Performance
Compares visibility metrics across the categories defined when creating analyses (aligned with your internal product segmentation). Quickly identify where your brand is strongly represented in AI answers and where competitors dominate.
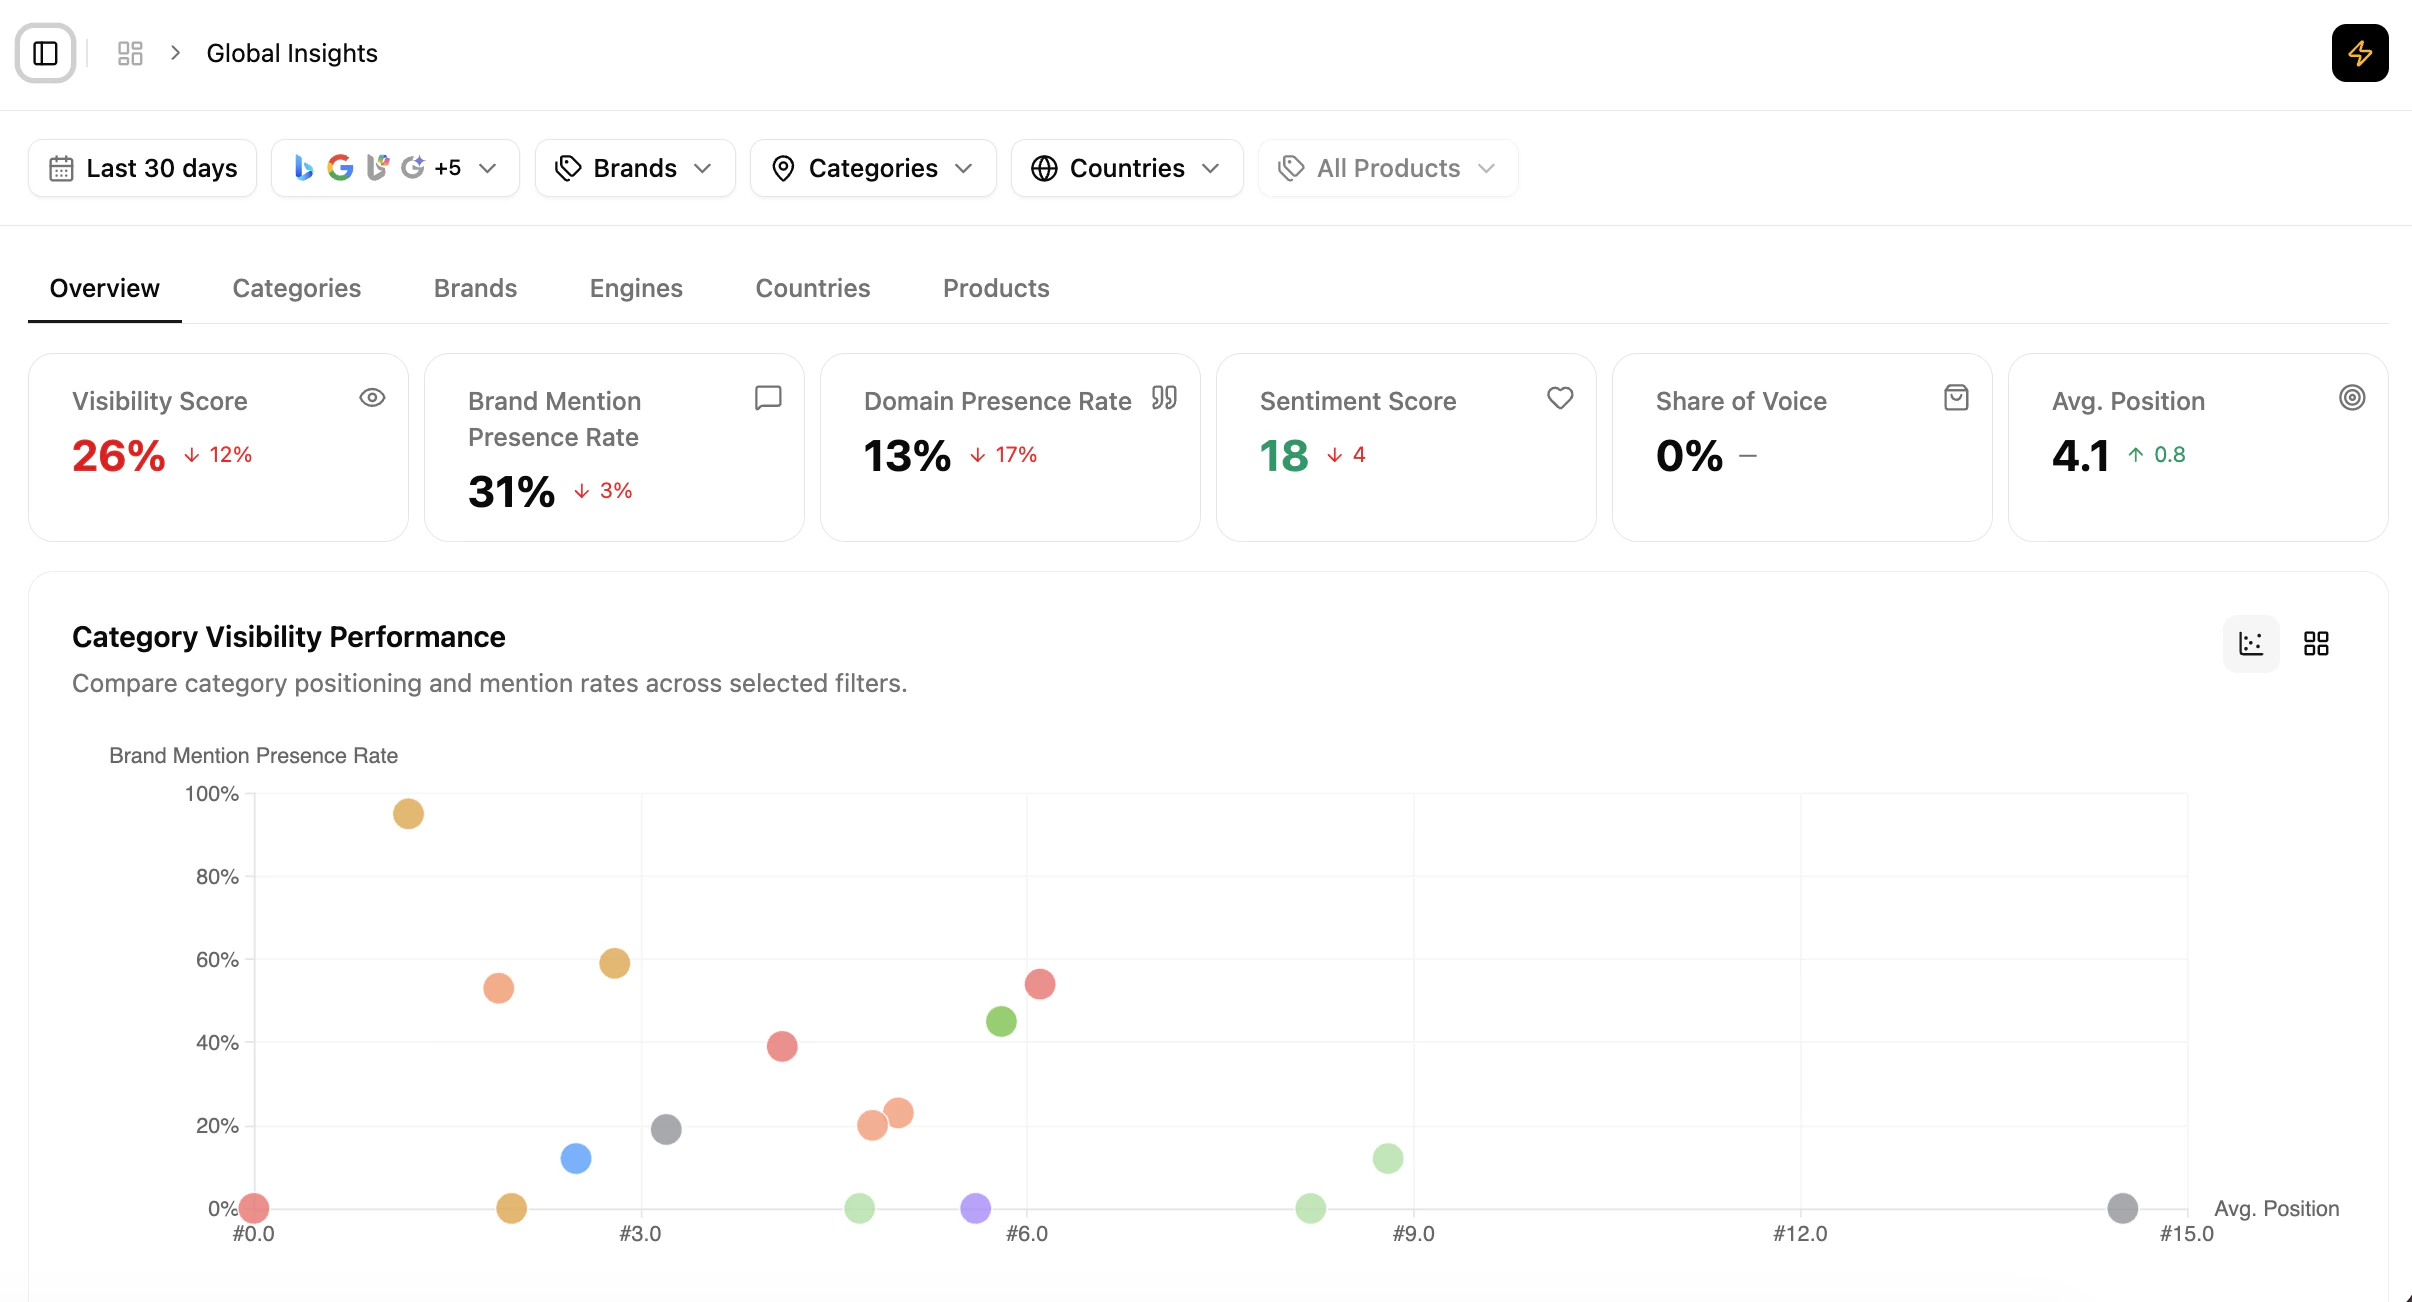 Useful for marketing, SEO and product teams prioritising actions per category and aligning AI insights with internal product structure.
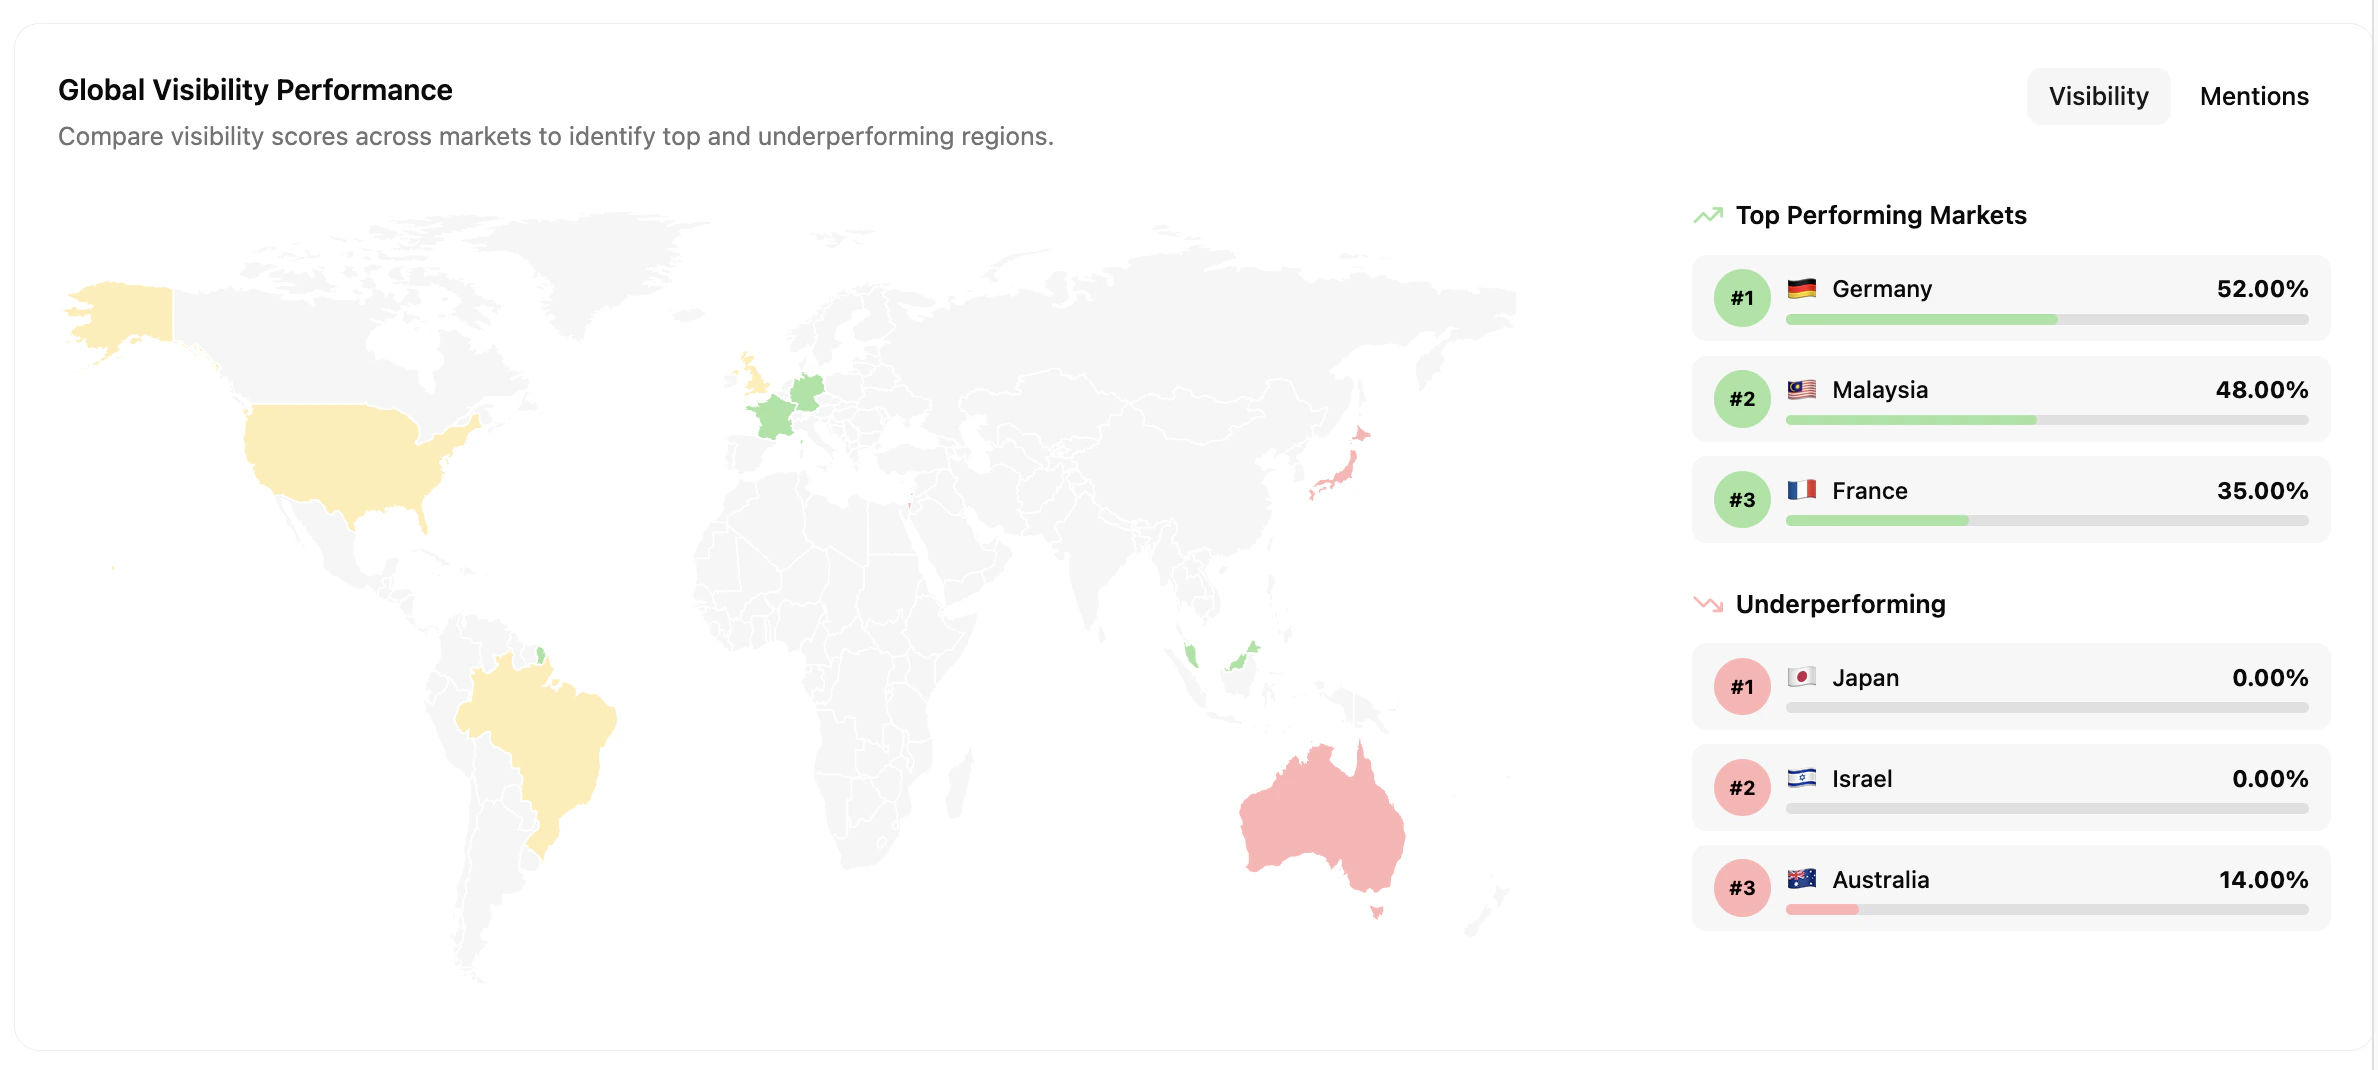
### Global Visibility Performance
Compares brand performance across markets using **Visibility Score** and **Brand Mention Presence Rate**. Identify the countries where your brand is most visible and where performance is weaker.
Useful for marketing, SEO and product teams prioritising actions per category and aligning AI insights with internal product structure.
### Global Visibility Performance
Compares brand performance across markets using **Visibility Score** and **Brand Mention Presence Rate**. Identify the countries where your brand is most visible and where performance is weaker.
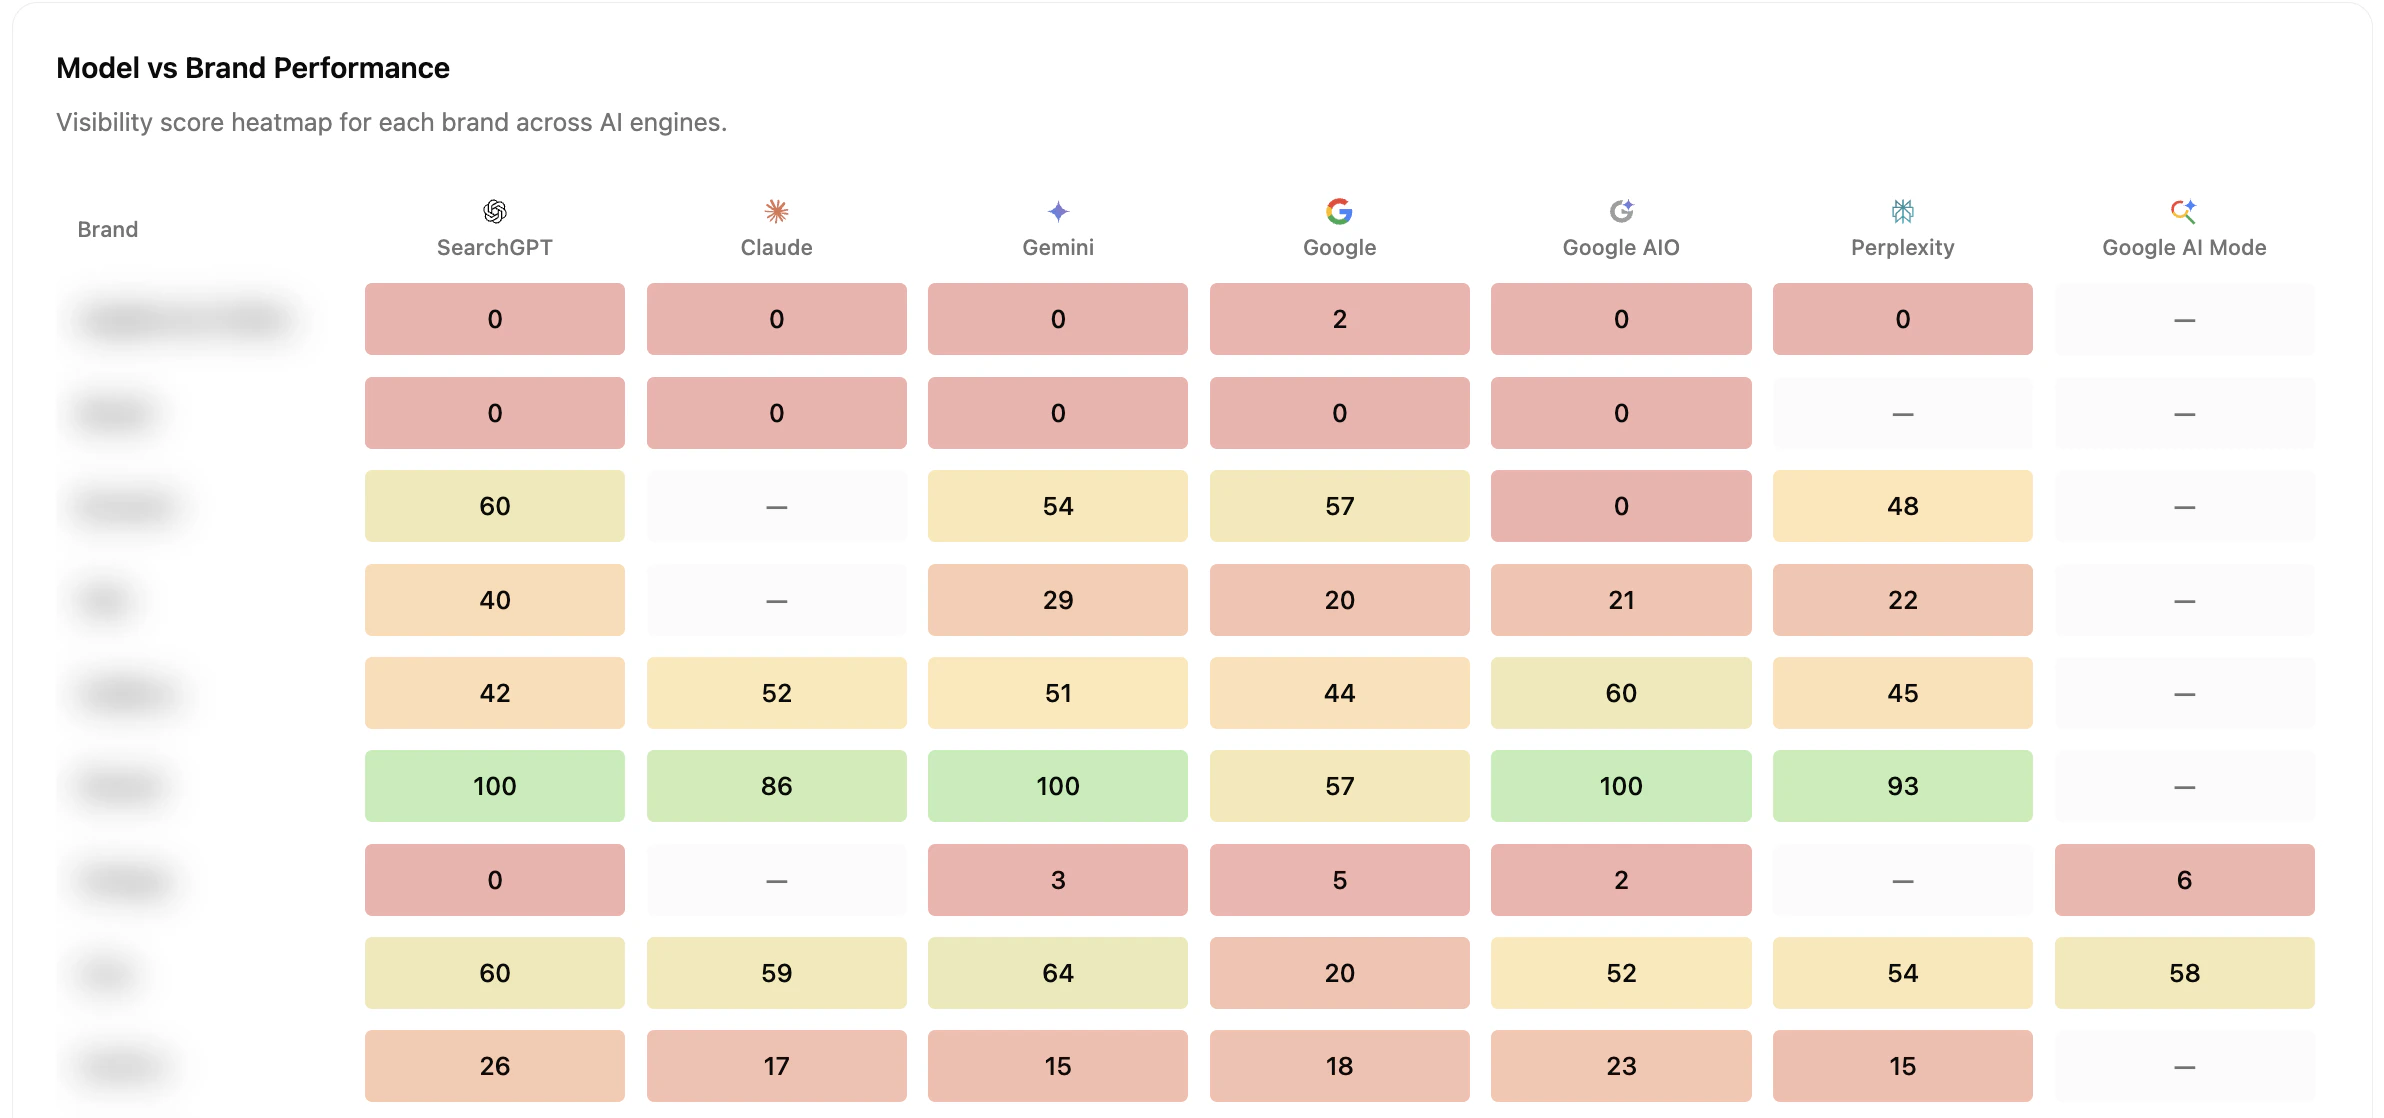
 ### Model vs. Brand Performance
A heatmap comparing brand Visibility Scores across AI engines. Highlights where each brand performs strongly or weakly per model.
### Model vs. Brand Performance
A heatmap comparing brand Visibility Scores across AI engines. Highlights where each brand performs strongly or weakly per model.
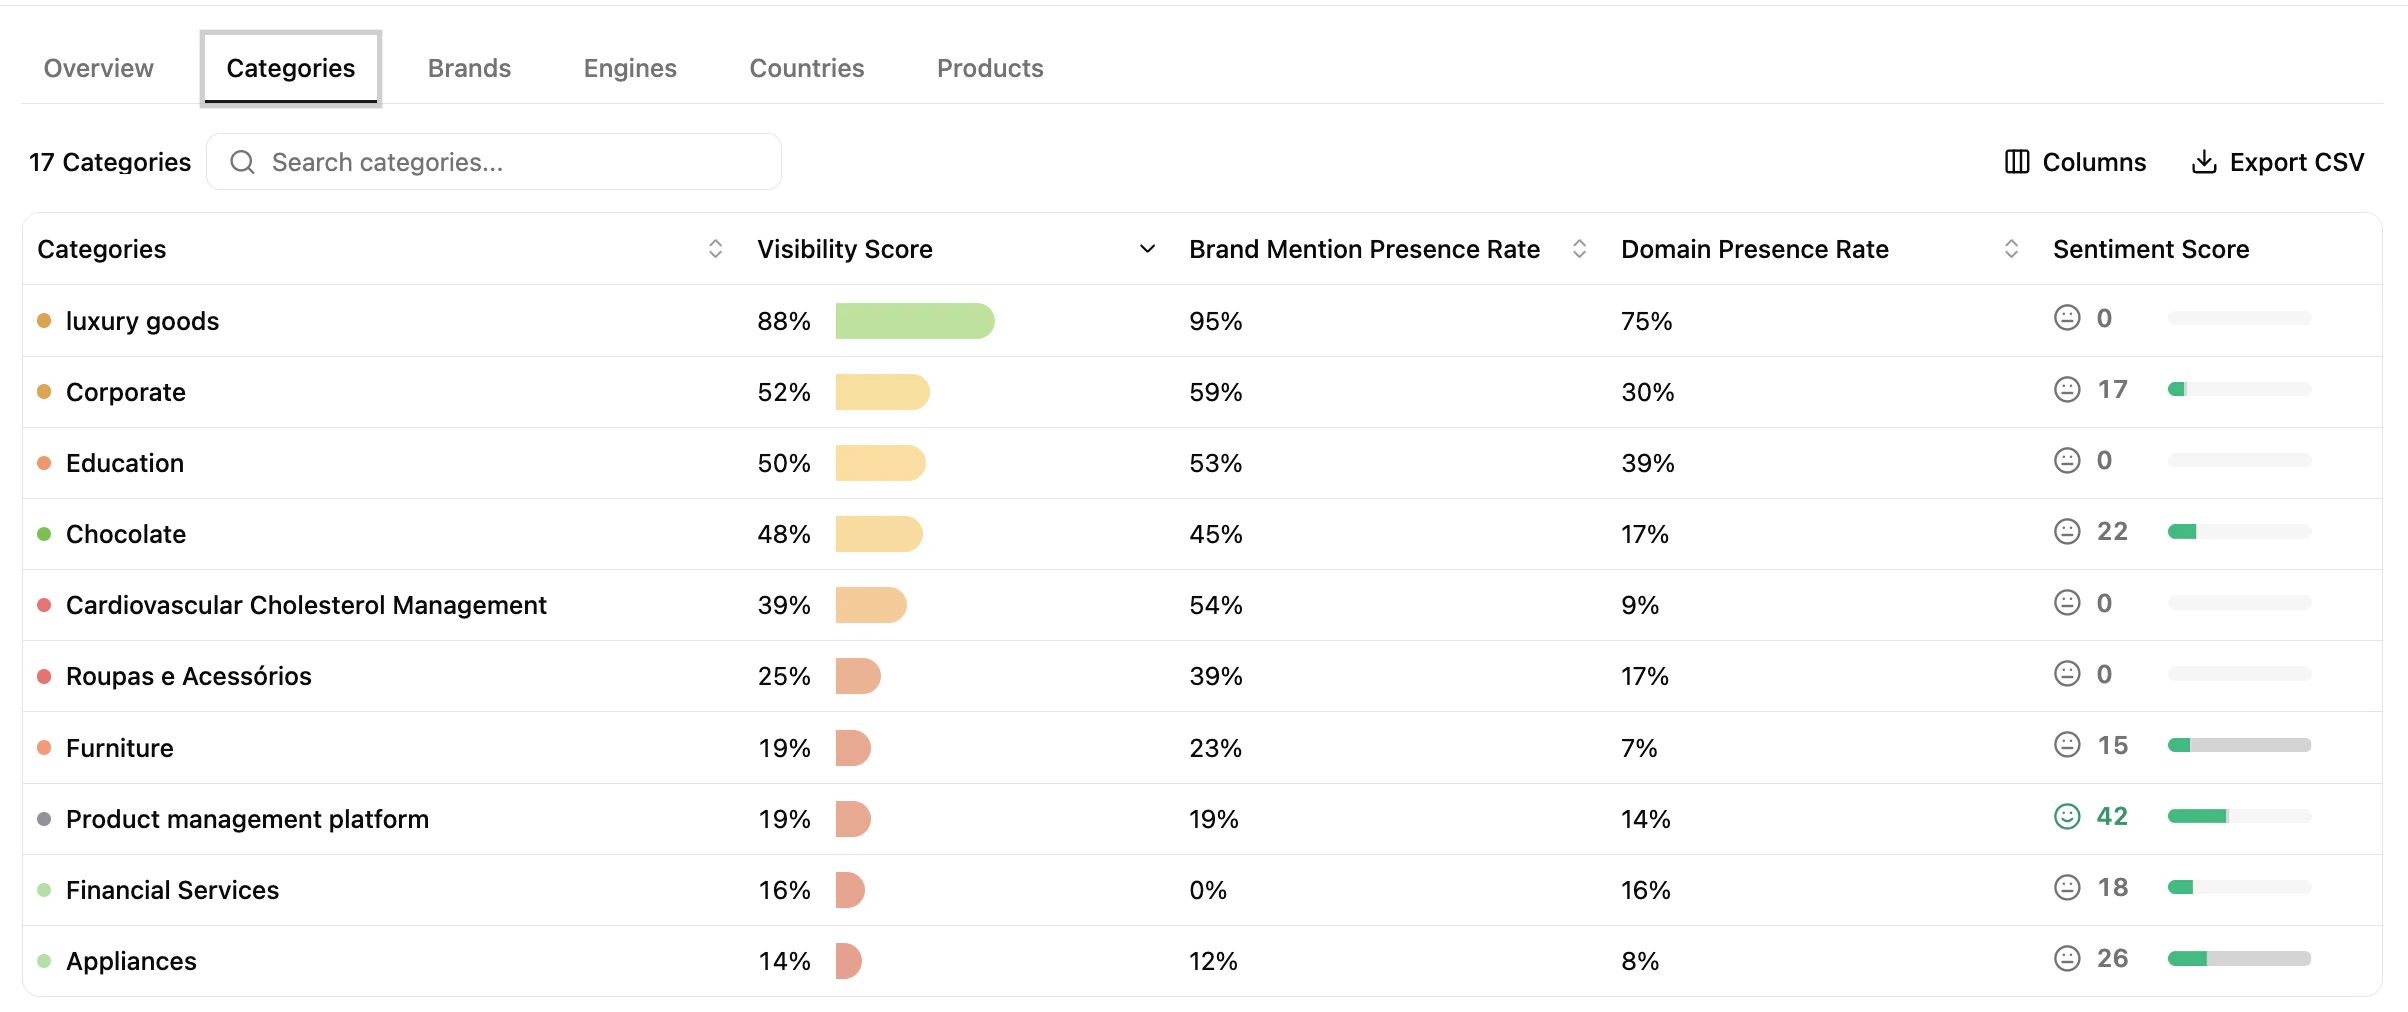
 ### Performance — Category, Brand, Engine, Country
Drill down across multiple dimensions to identify where visibility is strong or weak and where to prioritise optimisation across markets and AI platforms.
### Performance — Category, Brand, Engine, Country
Drill down across multiple dimensions to identify where visibility is strong or weak and where to prioritise optimisation across markets and AI platforms.
 ## What's next
Drill into the underlying analyses.
Understand how the score is built.
## What's next
Drill into the underlying analyses.
Understand how the score is built.