> ## Documentation Index
> Fetch the complete documentation index at: https://docs.shareofmodel.ai/llms.txt
> Use this file to discover all available pages before exploring further.
# Overview
> Understand how sponsored ad is emerging across conversational AI experiences, where advertisers compete, and how paid presence interacts with organic visibility.
Conversational AI assistants are becoming a **new advertising surface within the search and discovery journey**.
Alongside organic answers, some LLMs increasingly surface **sponsored products and content directly within their responses**, creating new opportunities for advertisers to reach users.
This changes what AI visibility means for brands. It is no longer only about **whether your brand appears organically**, but also about **where advertising is emerging, which advertisers are buying that visibility, and whether paid placements reinforce or replace organic presence.**
**Ads extends your existing Search project to this paid visibility layer.** It analyses the same tracked prompts and surfaces the sponsored placements found within those responses, allowing you to understand not only **who earns visibility organically**, but also **who pays to appear alongside it.**
 ## What this view helps you analyse
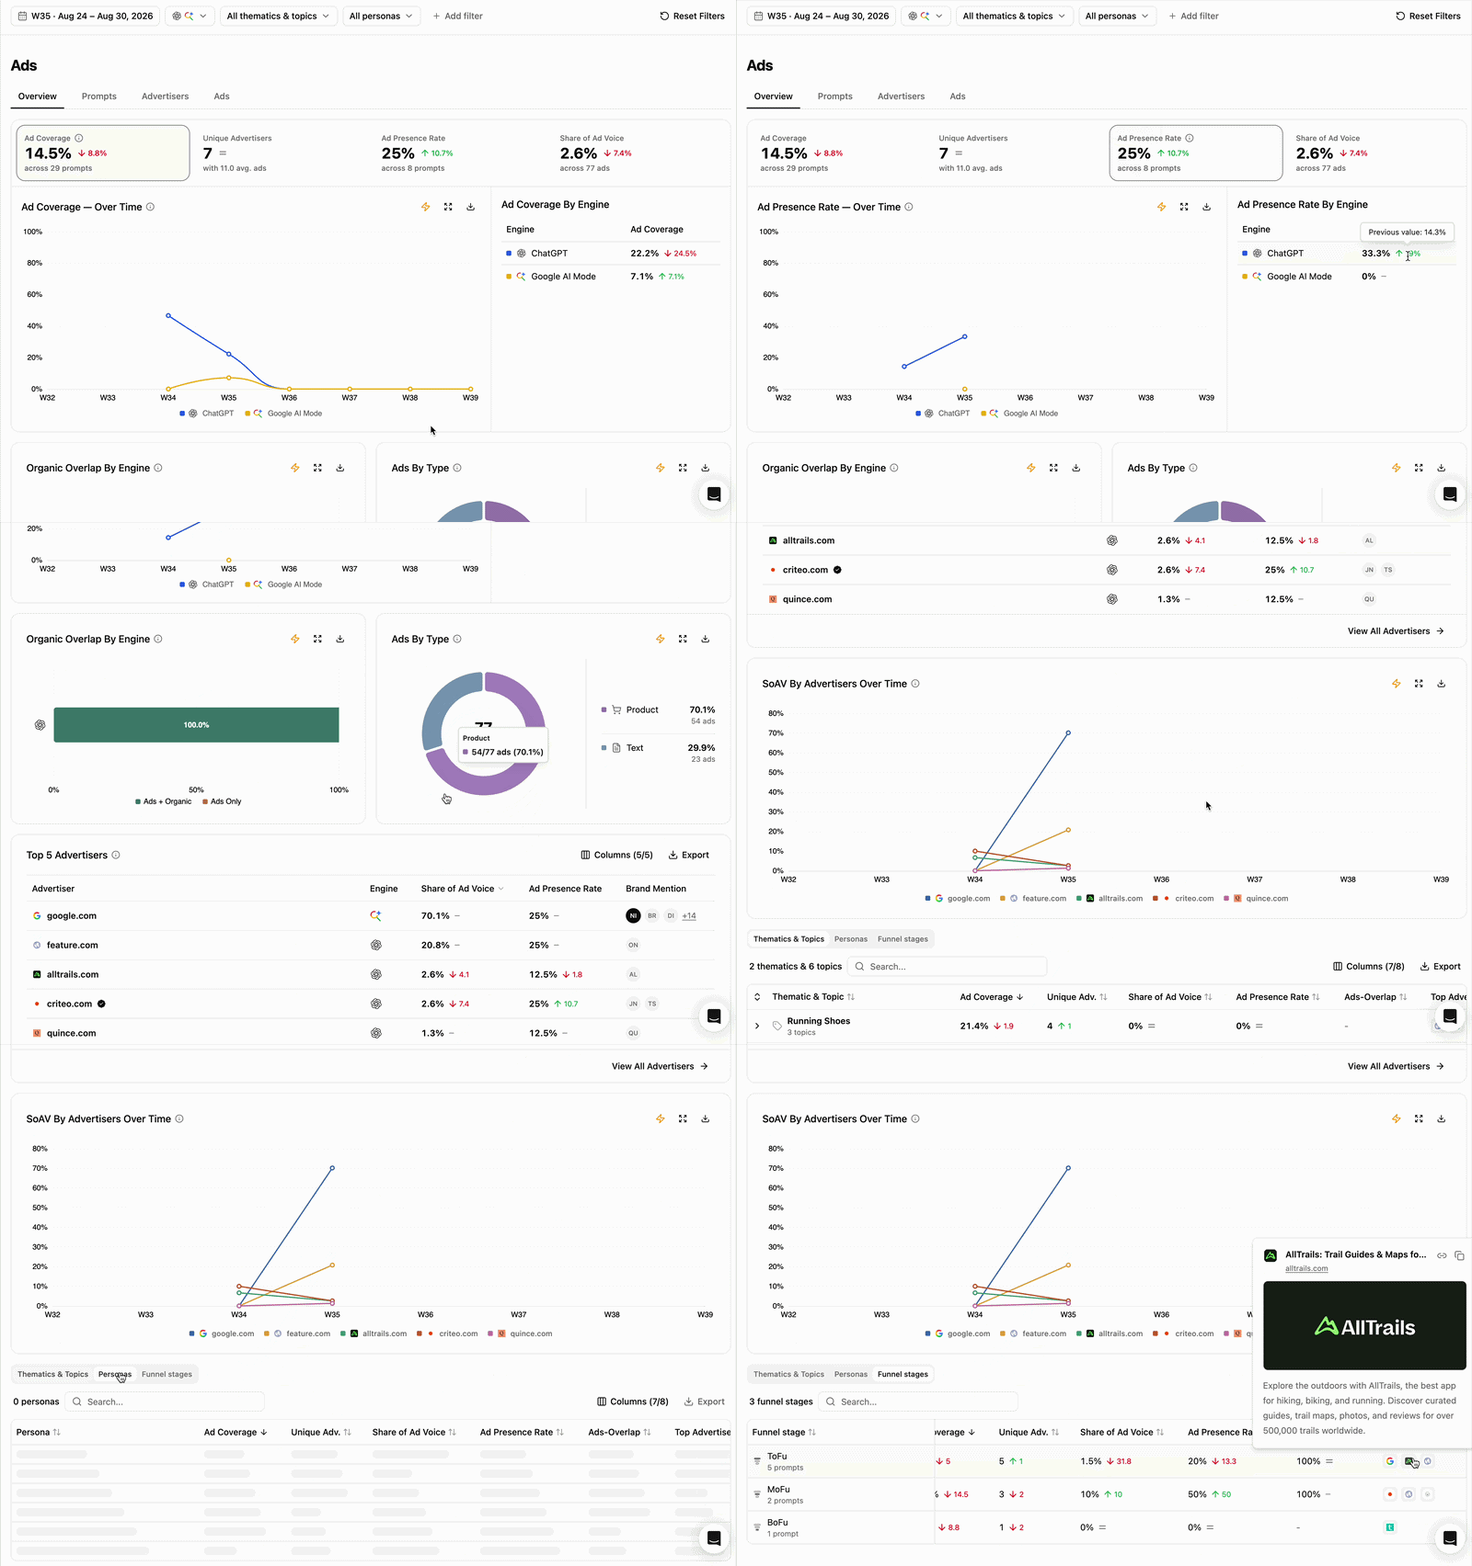
Ads Overview is the starting point for analysing the **AI advertising landscape** across your tracked prompt territory.
It helps you understand:
* How much of your prompt territory is already monetized?
* How is advertising evolving across AI engines?
* How many advertisers are competing for paid visibility?
* Which advertisers capture the most visibility?
* Where does paid visibility overlap with organic presence?
* Which thematics, topics, personas or funnel stages attract the most advertising activity?
Think of it as the homepage of your **AI advertising landscape**.
Ads currently analyses sponsored placements across **ChatGPT and Google AI Mode**.
### Advertising Landscape Snapshot
## What this view helps you analyse
Ads Overview is the starting point for analysing the **AI advertising landscape** across your tracked prompt territory.
It helps you understand:
* How much of your prompt territory is already monetized?
* How is advertising evolving across AI engines?
* How many advertisers are competing for paid visibility?
* Which advertisers capture the most visibility?
* Where does paid visibility overlap with organic presence?
* Which thematics, topics, personas or funnel stages attract the most advertising activity?
Think of it as the homepage of your **AI advertising landscape**.
Ads currently analyses sponsored placements across **ChatGPT and Google AI Mode**.
### Advertising Landscape Snapshot
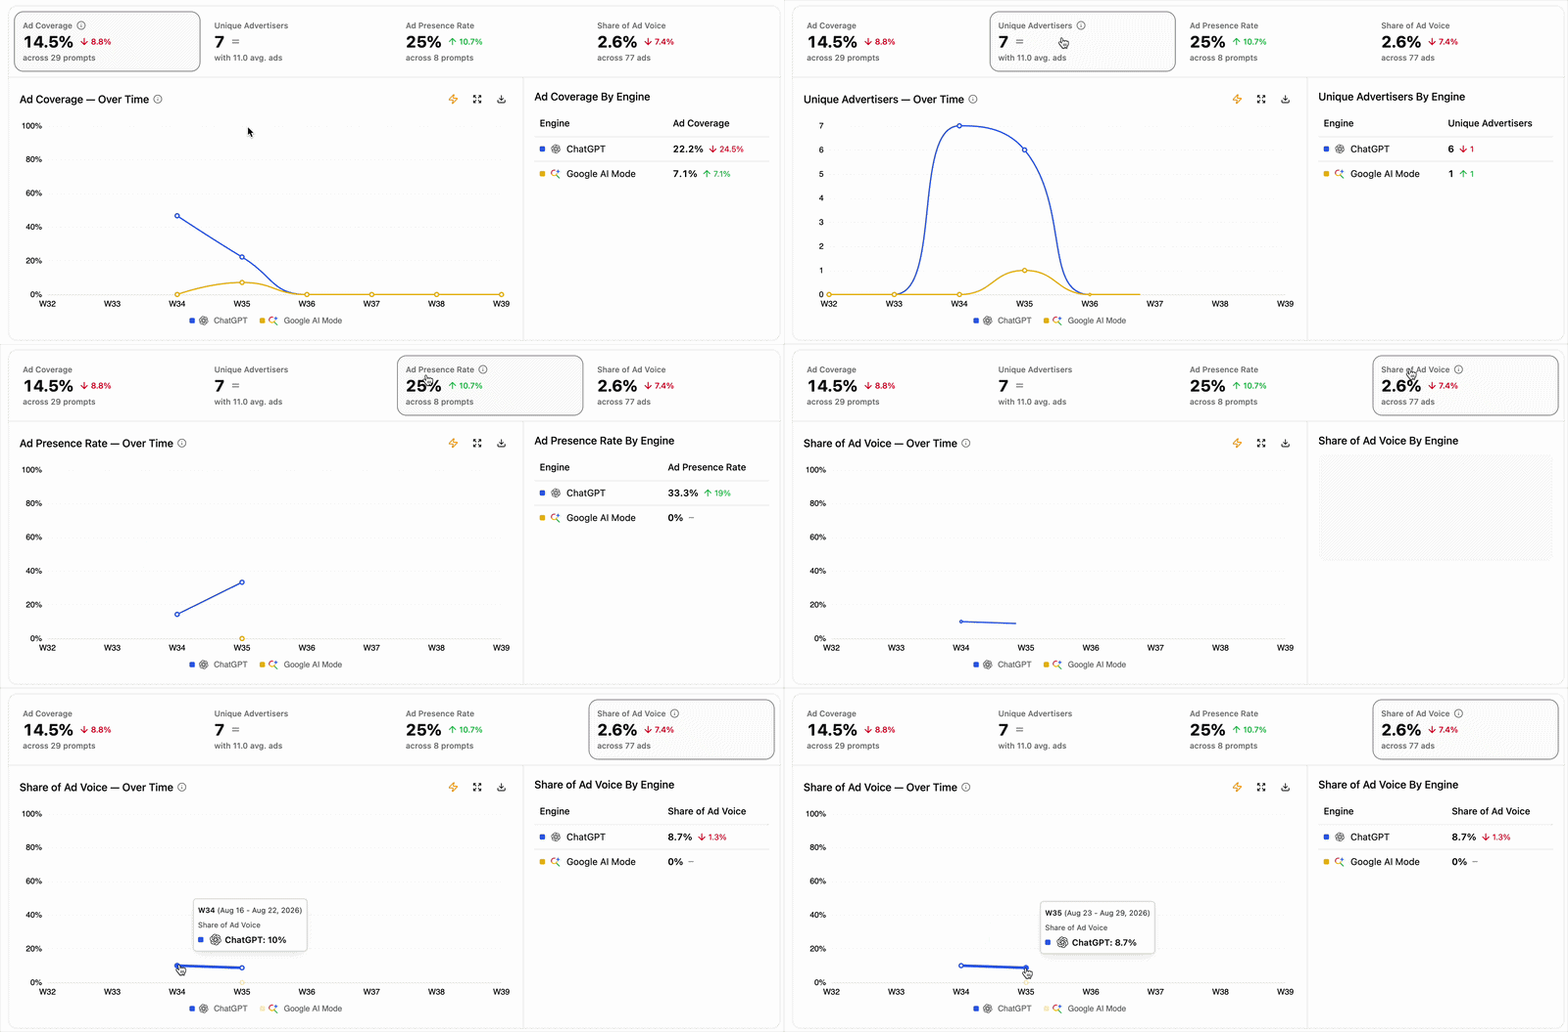 The headline metrics provide an immediate view of advertising activity across your current analysis:
* **Ad Coverage** shows how much of your tracked prompt territory contains advertising.
* **Unique Advertisers** shows how many advertisers are competing within that space.
* **Ad Presence Rate** shows how broadly an advertiser appears across prompts where advertising exists.
* **Share of Ad Voice** shows how much of the total paid visibility is captured by an advertiser.
Together, these metrics help you size both **the level of monetization** and **the competitive dynamics** of your AI advertising landscape.
Select any scorecard to update the graph below and track how that signal evolves **over time and by engine**.
Start with Ad Coverage to understand how established advertising is across your prompt territory, then move to advertiser-level metrics to understand who captures that opportunity.
### How paid and organic visibility interact
The headline metrics provide an immediate view of advertising activity across your current analysis:
* **Ad Coverage** shows how much of your tracked prompt territory contains advertising.
* **Unique Advertisers** shows how many advertisers are competing within that space.
* **Ad Presence Rate** shows how broadly an advertiser appears across prompts where advertising exists.
* **Share of Ad Voice** shows how much of the total paid visibility is captured by an advertiser.
Together, these metrics help you size both **the level of monetization** and **the competitive dynamics** of your AI advertising landscape.
Select any scorecard to update the graph below and track how that signal evolves **over time and by engine**.
Start with Ad Coverage to understand how established advertising is across your prompt territory, then move to advertiser-level metrics to understand who captures that opportunity.
### How paid and organic visibility interact
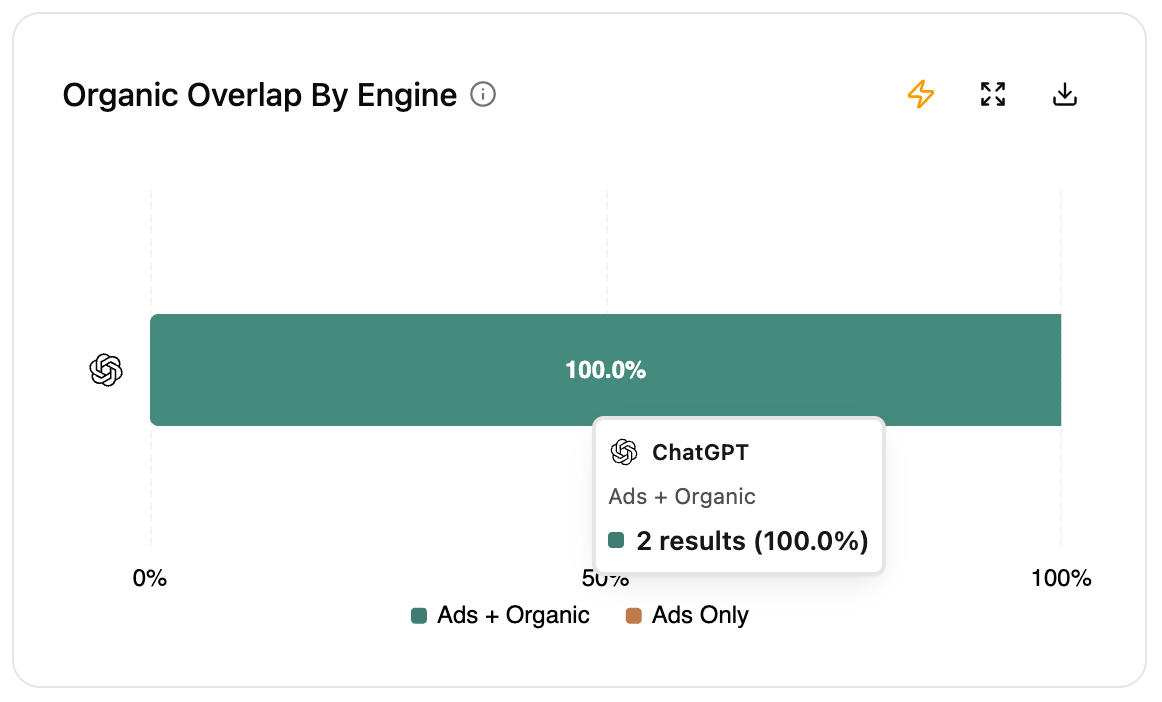 Paid visibility does not exist independently from organic visibility.
The **Ads + Organic** and **Ads Only** signals reveal whether an advertiser's paid presence reinforces visibility it already earns organically or creates visibility where it would otherwise be absent.
* **Ads + Organic**: the advertiser appears both through an ad and organically (either a mention of the brand, or the domain, is displayed organically).
* **Ads Only**: the advertiser appears through an ad but not organically.
Together, they help you understand **the role paid visibility plays within an advertiser's broader AI presence**. A high overlap can reveal areas where paid and organic visibility coexist, while high Ads Only indicates areas where advertising is responsible for the advertiser's presence.
### Who captures paid visibility
Paid visibility does not exist independently from organic visibility.
The **Ads + Organic** and **Ads Only** signals reveal whether an advertiser's paid presence reinforces visibility it already earns organically or creates visibility where it would otherwise be absent.
* **Ads + Organic**: the advertiser appears both through an ad and organically (either a mention of the brand, or the domain, is displayed organically).
* **Ads Only**: the advertiser appears through an ad but not organically.
Together, they help you understand **the role paid visibility plays within an advertiser's broader AI presence**. A high overlap can reveal areas where paid and organic visibility coexist, while high Ads Only indicates areas where advertising is responsible for the advertiser's presence.
### Who captures paid visibility
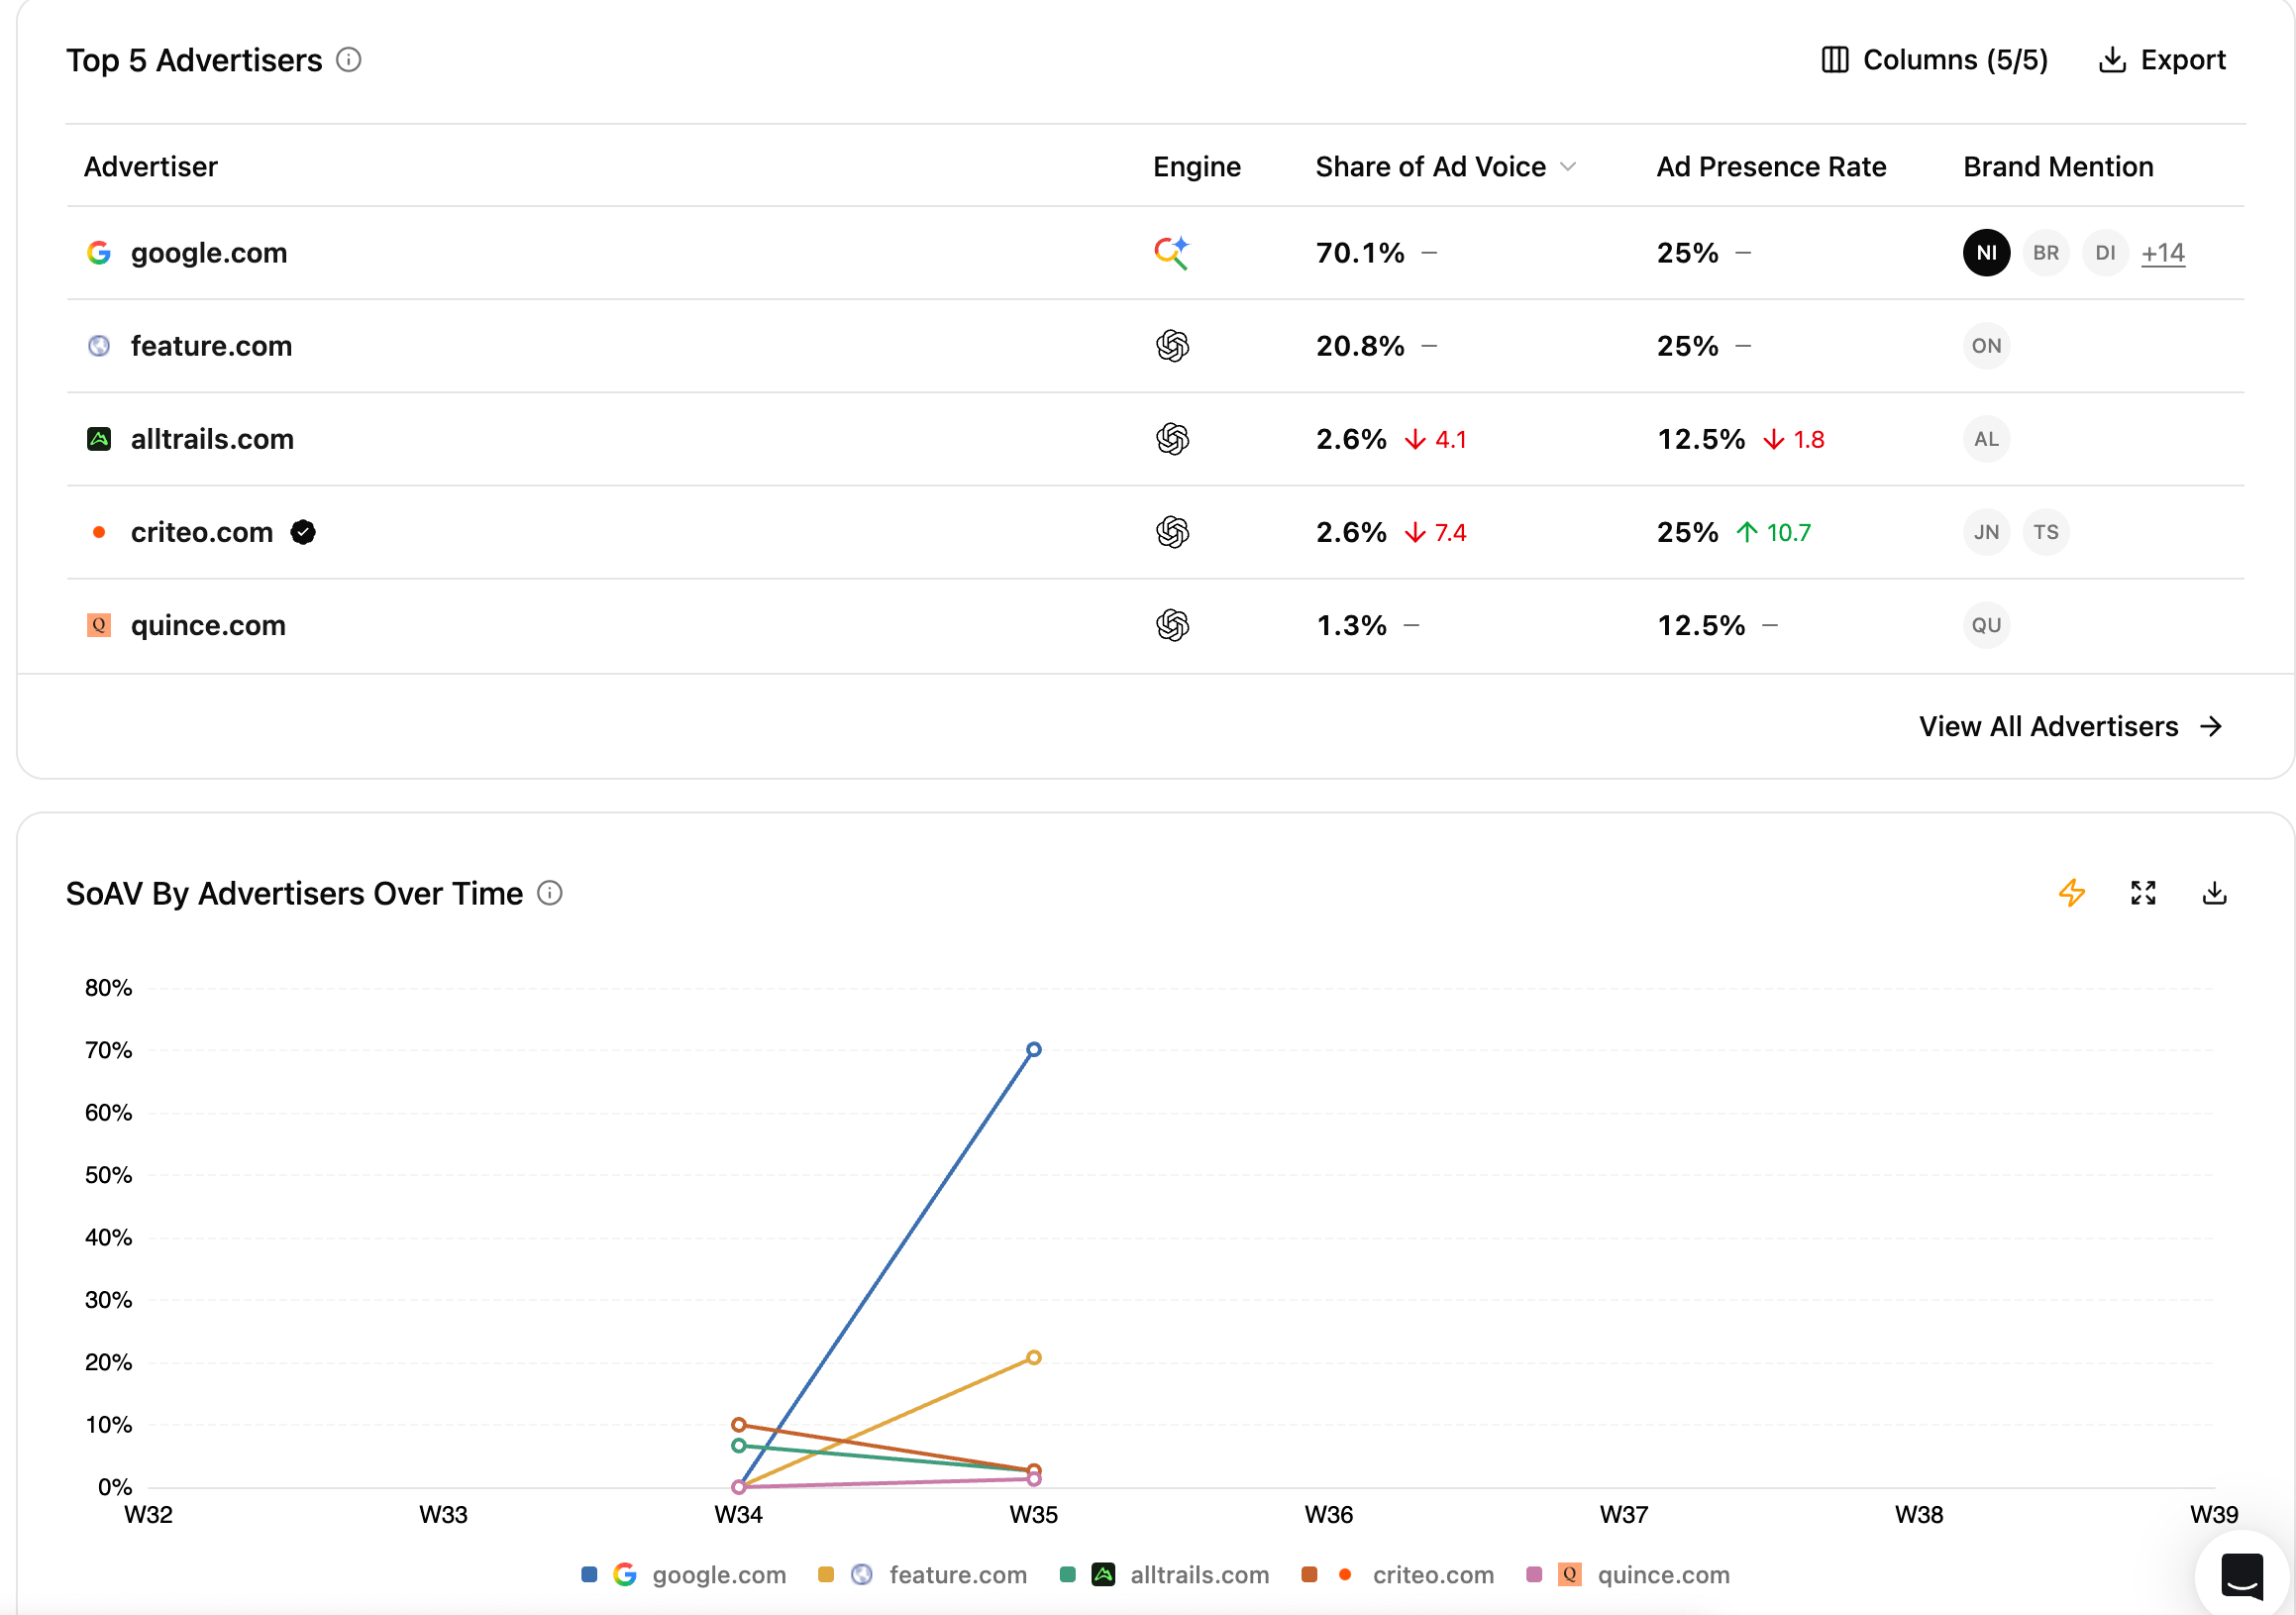 The advertiser ranking reveals **who occupies the paid layer of your AI search landscape**.
Compare **Share of Ad Voice** to understand how total advertising visibility is distributed between advertisers, and **Ad Presence Rate** to understand how broadly each advertiser covers the prompts where ads appear.
The evolution view then helps you see how that competitive distribution changes over time.
**What do we mean by advertiser?**
An advertiser is identified from the **domain retrieved from an ad**. It may therefore differ from the brand or product being promoted. For example, Google Shopping placements can be attributed to `google.com` when Google is the domain used in the ad redirect.
**Brand Mentions** help you identify the brands actually promoted through each advertiser.
This provides the competitive layer of Ads analysis: not only **whether advertising exists**, but **who captures that paid visibility and which brands they promote**.
### Where advertising concentrates
The advertiser ranking reveals **who occupies the paid layer of your AI search landscape**.
Compare **Share of Ad Voice** to understand how total advertising visibility is distributed between advertisers, and **Ad Presence Rate** to understand how broadly each advertiser covers the prompts where ads appear.
The evolution view then helps you see how that competitive distribution changes over time.
**What do we mean by advertiser?**
An advertiser is identified from the **domain retrieved from an ad**. It may therefore differ from the brand or product being promoted. For example, Google Shopping placements can be attributed to `google.com` when Google is the domain used in the ad redirect.
**Brand Mentions** help you identify the brands actually promoted through each advertiser.
This provides the competitive layer of Ads analysis: not only **whether advertising exists**, but **who captures that paid visibility and which brands they promote**.
### Where advertising concentrates
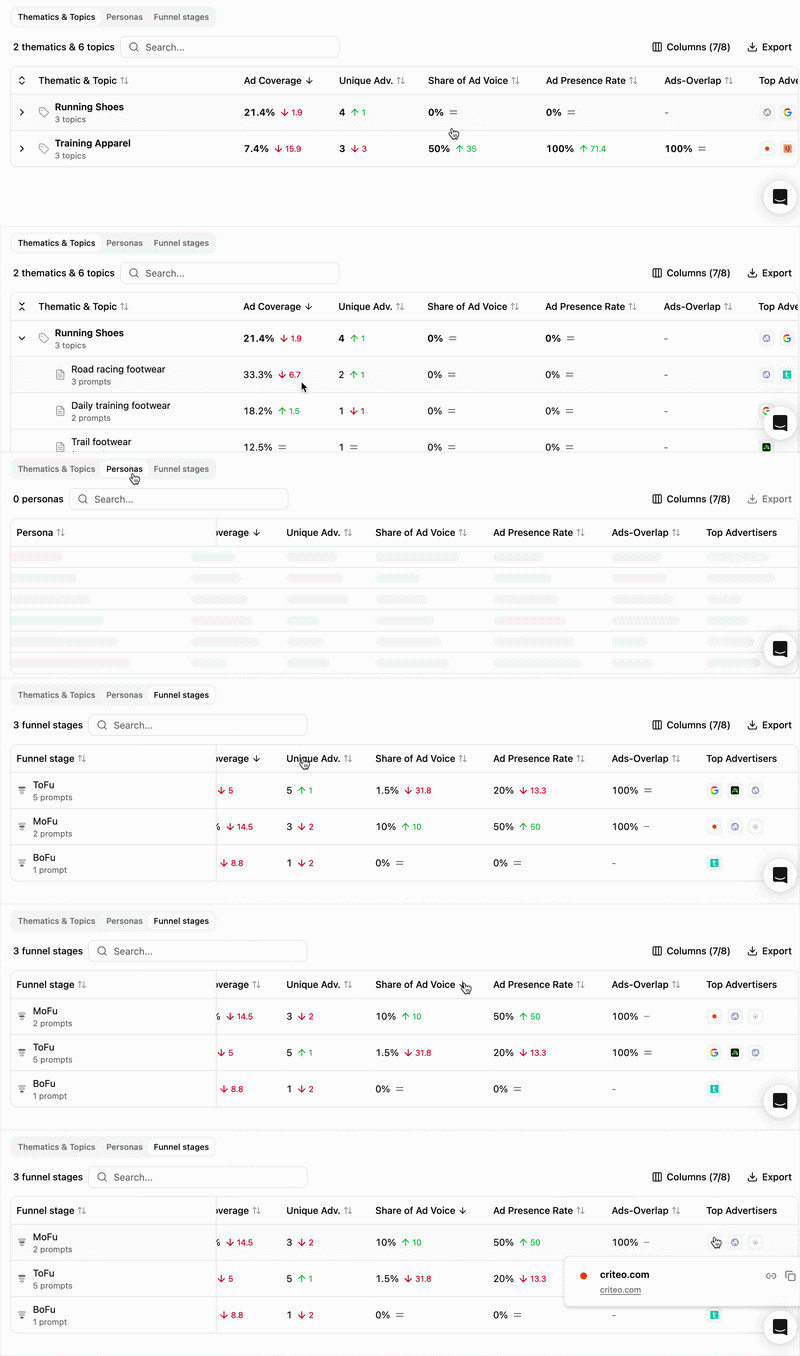 Advertising pressure is not necessarily distributed evenly across your prompt territory.
Break down your analysis by **Thematics & Topics, Personas or Funnel stages** to understand where advertisers are most active.
For each segment, compare Ad Coverage, Unique Advertisers, Share of Ad Voice, Ad Presence Rate and paid-organic overlap to identify:
* areas with strong advertising activity,
* areas attracting many competing advertisers,
* parts of the journey where paid and organic visibility frequently coexist,
* segments where advertising remains limited or absent.
This helps connect advertising activity back to the **user needs and journeys represented by your tracked prompts**.
## Reading cues
These are signals to read, not rules.
Advertising is appearing across a larger share of your tracked prompt territory. Compare engines to understand whether this reflects a broad evolution or activity concentrated on one platform.
Advertising is both widespread and competitive within that part of your prompt territory.Multiple advertisers are competing for an already well-monetized space.
Paid placements frequently coexist with organic visibility for the same advertiser. Investigate the underlying prompts to understand where paid visibility may be reinforcing presence already earned organically.
Advertising is creating visibility where the advertiser does not appear organically. This can highlight areas where the advertiser relies more heavily on paid presence.
## How to use this view effectively
Start with the **Advertising Landscape Snapshot** to understand how established advertising is and how it evolves across engines.
Then compare **paid vs organic visibility** and **Top Advertisers** to understand who captures the opportunity and how dependent that visibility is on ads.
Finally, use the breakdowns to identify **where advertising concentrates**, then move into Prompts, Advertisers or Ads for deeper analysis.
## Extra features
* **Filters** — refine the data displayed.
* **Add/Hide columns** — adapt the table to your workflow.
* **Export** — extract filtered tables to CSV or Excel.
* **Search** — find a brand or product via the search bar.
* **Sort** — order by any column.
## What's next
Identify where advertising appears across your tracked prompts.
Understand who is buying sponsored placement visibility.
Advertising pressure is not necessarily distributed evenly across your prompt territory.
Break down your analysis by **Thematics & Topics, Personas or Funnel stages** to understand where advertisers are most active.
For each segment, compare Ad Coverage, Unique Advertisers, Share of Ad Voice, Ad Presence Rate and paid-organic overlap to identify:
* areas with strong advertising activity,
* areas attracting many competing advertisers,
* parts of the journey where paid and organic visibility frequently coexist,
* segments where advertising remains limited or absent.
This helps connect advertising activity back to the **user needs and journeys represented by your tracked prompts**.
## Reading cues
These are signals to read, not rules.
Advertising is appearing across a larger share of your tracked prompt territory. Compare engines to understand whether this reflects a broad evolution or activity concentrated on one platform.
Advertising is both widespread and competitive within that part of your prompt territory.Multiple advertisers are competing for an already well-monetized space.
Paid placements frequently coexist with organic visibility for the same advertiser. Investigate the underlying prompts to understand where paid visibility may be reinforcing presence already earned organically.
Advertising is creating visibility where the advertiser does not appear organically. This can highlight areas where the advertiser relies more heavily on paid presence.
## How to use this view effectively
Start with the **Advertising Landscape Snapshot** to understand how established advertising is and how it evolves across engines.
Then compare **paid vs organic visibility** and **Top Advertisers** to understand who captures the opportunity and how dependent that visibility is on ads.
Finally, use the breakdowns to identify **where advertising concentrates**, then move into Prompts, Advertisers or Ads for deeper analysis.
## Extra features
* **Filters** — refine the data displayed.
* **Add/Hide columns** — adapt the table to your workflow.
* **Export** — extract filtered tables to CSV or Excel.
* **Search** — find a brand or product via the search bar.
* **Sort** — order by any column.
## What's next
Identify where advertising appears across your tracked prompts.
Understand who is buying sponsored placement visibility.